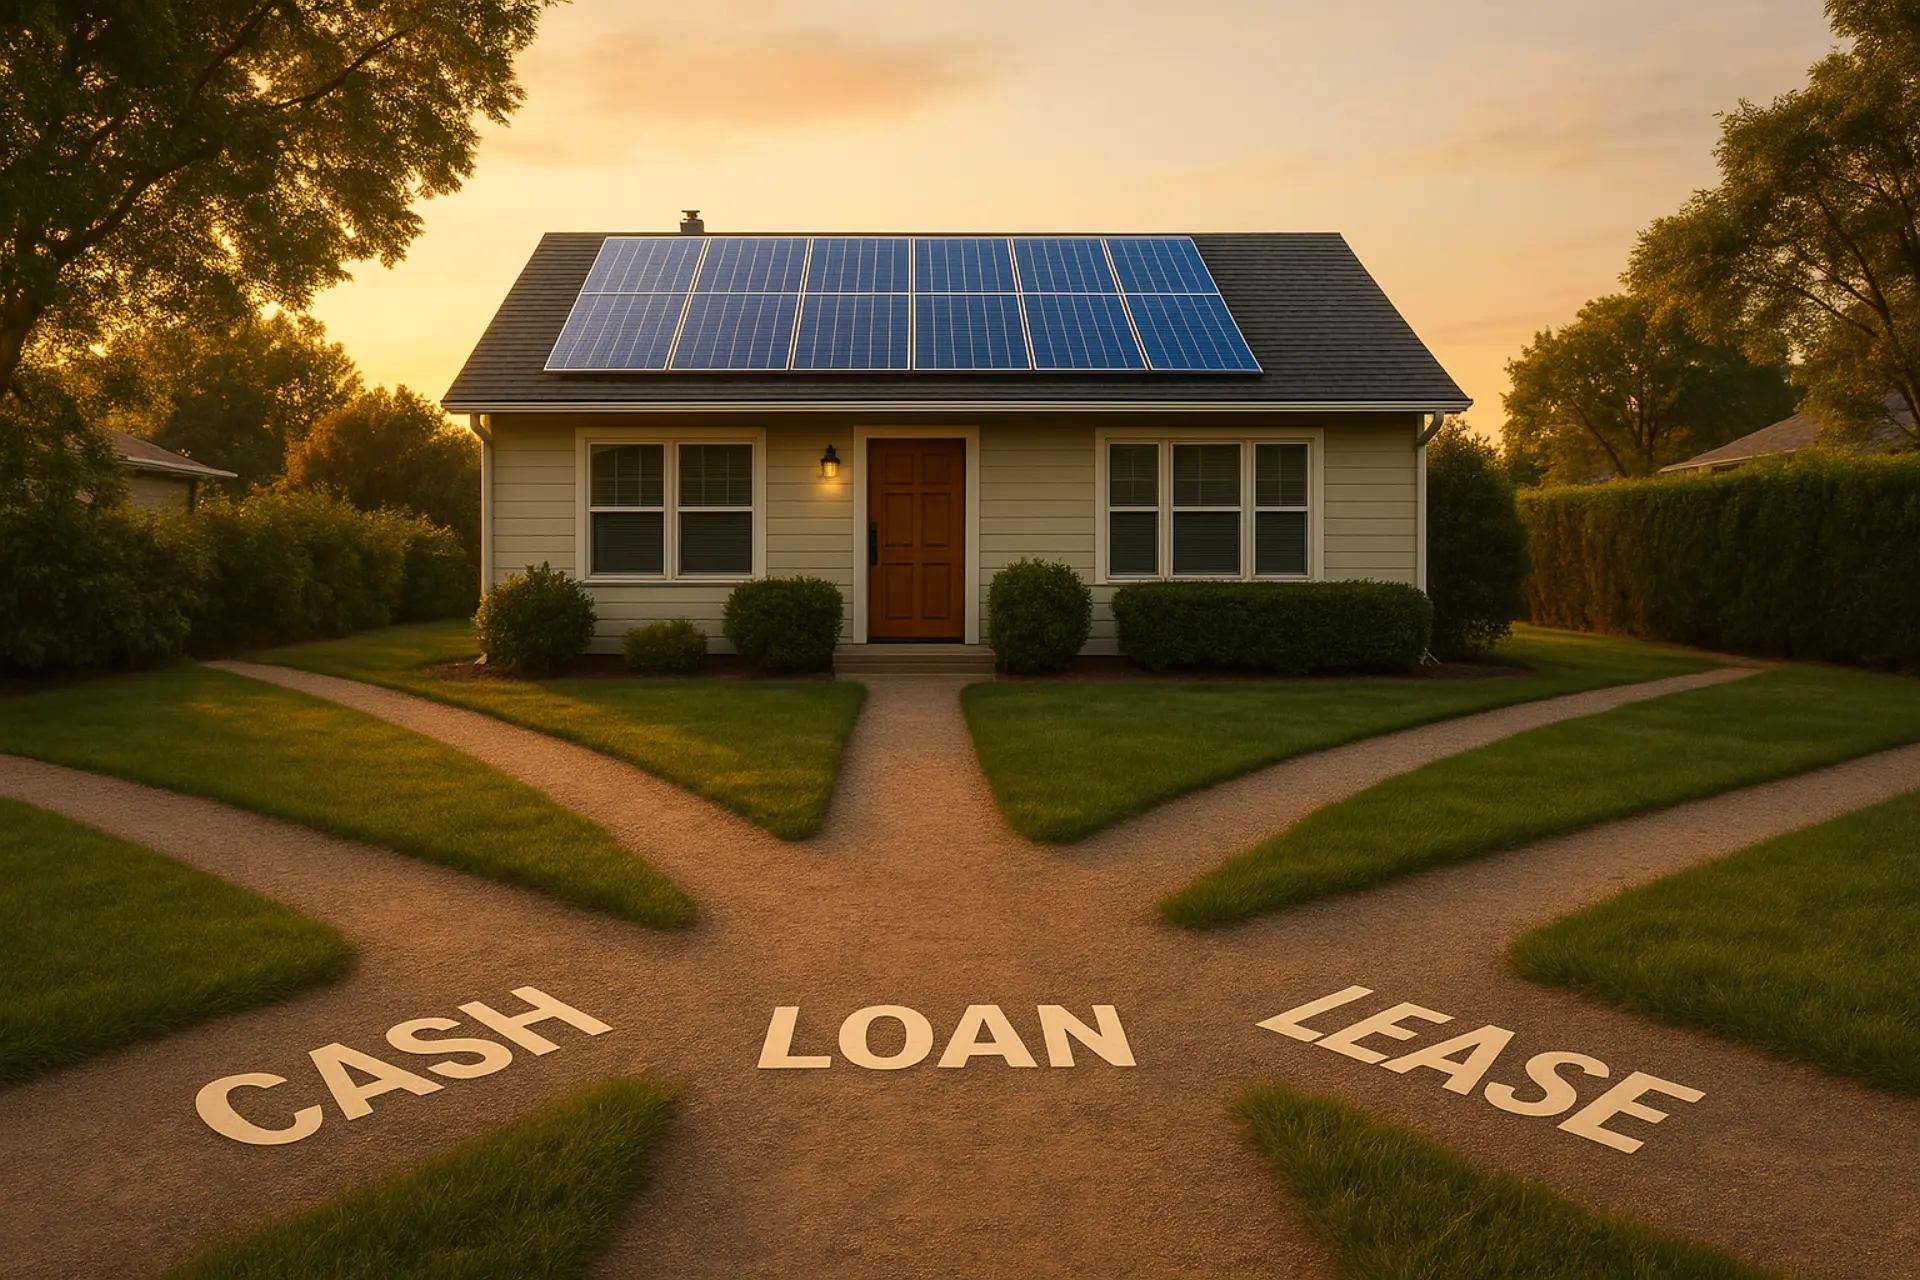
With no federal credit, lease and PPA now offer faster Day 1 savings than cash in most states. Cash still wins on 25-year total value, but the gap has narrowed significantly.
Cash Payback
~9 yrs
without federal credit
Loan Payback
~12 yrs
with typical APR
Lease/PPA
Day 1
instant savings
Cash 25-yr ROI
275%
best long-term
The 4 Solar Financing Options in 2026
Every solar buyer faces the same question: cash, loan, lease, or PPA? With the federal residential tax credit gone, the math has changed dramatically. The old rule of thumb — "cash is always best" — no longer holds universally. Here is an honest comparison using a typical 10 kW system in Massachusetts ($32,500 before incentives, $0.30/kWh electricity rate, 12,000 kWh annual production).
| Factor | Cash | Solar Loan | Lease | PPA |
|---|---|---|---|---|
| Upfront Cost | $32,500 | $0 | $0 | $0 |
| Monthly Payment | $0 | ~$215 | ~$135 | ~$0.12/kWh |
| Federal Tax Credit | $0 | $0 | 30% (to company) | 30% (to company) |
| Year 1 Savings | ~$3,600 | ~$1,000 | ~$1,800 | ~$2,100 |
| Payback Period | ~9 years | ~12 years | Day 1 | Day 1 |
| 25-Year Total | ~$122,000 | ~$85,000 | ~$55,000 | ~$60,000 |
| Own the System? | Yes | Yes | No | No |
Cash Purchase: Highest Total Return, Biggest Outlay
Cash purchase provides the highest total savings over 25 years because there is no interest, no monthly payment, and you keep 100% of the production value. The downside is the $25,000–$40,000 upfront cost with no federal credit to offset it. In 2024, that same $32,500 system had a net cost of $22,750 after the 30% federal credit ($9,750 back). In 2026, you pay the full $32,500.
Real-world cash example — Boston homeowner: Jane pays $34,000 cash for an 11 kW system in January 2026. She receives $4,400 from Massachusetts SMART incentives over 10 years ($440/year in bill credits). Her electricity bill drops from $310/month to $45/month (still paying Eversource fixed charges). Annual savings: $3,180. With utility rate inflation at 4%/year, she breaks even in year 9. By year 25, total savings reach $128,000.
Cash purchase makes sense if:
- You have liquid savings available
- Plan to stay in the home 10+ years
- Want to maximize lifetime savings
- Can tolerate the upfront cost without straining finances
Solar Loan: Own the System, Pay Over Time
A solar loan lets you own the system with $0 down. However, interest costs (typically 6–9% APR in 2026) reduce your total savings vs cash. The key challenge: without the federal credit to make a lump payment and reduce the principal, loan balances stay higher longer. Many homeowners used their $9,750 ITC refund to pay down 30% of the loan immediately in 2024. That strategy no longer exists.
Dealer fee trap
Many solar loans include a hidden "dealer fee" of 15–25% that inflates the financed amount. A $32,500 system with 20% dealer fee becomes a $39,000 loan. The dealer fee compensates the lender for the 0% or low-rate promotional APR. You're paying interest; it's just hidden upfront. Always ask for the total financed amount and effective APR.
Real-world loan example — Worcester homeowner: Mike finances $32,500 at 7.5% APR over 20 years with a 20% dealer fee (total loan: $39,000). Monthly payment: $315. His electric bill was $280/month. Net increase: $35/month. He's spending more in the first 8 years than he saves. After the loan is paid off in year 20, his remaining 10 years produce $48,000 in free electricity. Total 25-year savings: $82,000 — better than renting from the utility but far less than cash.
Solar loan makes sense if: You want ownership benefits without upfront cost, can secure a loan under 7% APR with minimal dealer fees, and plan to stay 12+ years. Shop around — credit unions often offer better terms than solar-specific lenders. A 5% loan with no dealer fee is competitive; a 9% loan with 20% dealer fee is a poor deal.
Solar Lease: Predictable Payment, Instant Savings
A solar lease gives you a fixed monthly payment (typically $100–$175) that is lower than your current electric bill. The leasing company owns the system, handles all maintenance, and claims the 30% commercial ITC — allowing them to offer rates homeowners can no longer access on their own. You pay the lease plus a reduced utility bill for whatever solar doesn't cover.
Real-world lease example — New Hampshire homeowner: Sarah has a $260/month electric bill and no state incentives (NH offers minimal programs). A solar company offers her a 20-year lease at $125/month for a 9 kW system. Her utility bill drops to $70/month. New total: $195/month vs $260 before. She saves $65/month ($780/year) from day one with zero upfront cost. The company claimed $10,500 ITC on the $35,000 installed cost, enabling the low lease rate.
Lease escalator clause
Most leases include a 2–3% annual escalator, meaning your payment increases each year. A $125/month lease becomes $137 in year 5, $150 in year 10, and $165 in year 15. This mirrors utility rate inflation but caps your savings ceiling. Read the contract carefully and model the escalator against projected utility rate growth.
Solar lease makes sense if: You want guaranteed savings with zero risk, have no upfront capital, aren't concerned with maximizing lifetime savings, and value simplicity. Leases work especially well in states with weak incentive programs (NH, ME, VT) where the company's ITC provides more value than anything you could claim yourself.
PPA: Pay Only for What You Use
A Power Purchase Agreement (PPA) charges you a per-kWh rate (typically $0.10–$0.15/kWh) that is lower than your utility rate. You only pay for electricity the system produces. Like a lease, the PPA company owns the system and claims the 30% ITC. This option provides the most flexibility — if you use less electricity, you pay less.
Real-world PPA example — Rhode Island homeowner: Tom has National Grid service at $0.28/kWh and a $290/month bill. A solar company offers him a PPA at $0.13/kWh for 25 years with a 1.9% annual escalator. His 10 kW system produces 1,000 kWh/month. Solar charge: $130 (1,000 kWh × $0.13). Remaining utility bill: $90 (National Grid fixed charges + deficit kWh). New total: $220 vs $290 before. Savings: $70/month, $840/year.
PPA rate vs utility rate comparison: The PPA only saves money if the PPA rate stays below your utility rate. A $0.13/kWh PPA with 1.9% escalator reaches $0.18/kWh by year 20. If your utility rate grows slower than 1.9%, the PPA becomes more expensive than staying with the utility. Model this carefully. PPAs work best in states with fast utility rate inflation (MA, RI, CT at 3–5% annual growth).
PPA makes sense if: You want usage-based pricing with no fixed monthly cost, have variable electricity usage, prefer paying only for actual production, and live in a state with high utility rate inflation. PPAs provide the cleanest alignment of cost and value — you pay for solar electricity at below-utility rates and nothing more.
Ready to Get a Solar Quote?
Get a free, no-obligation quote from NuWatt Energy. We handle design, permits, and installation.
When Each Option Wins
Strong credit, long-term home
Cash
Maximum 25-year return. If you have the liquidity and plan to stay 10+ years, cash delivers the best total savings.
Good credit, limited savings
Solar Loan
Own the system with $0 down. Look for APR under 7% and minimal dealer fees from credit unions.
Selling home in 5–7 years
Lease or PPA
Day 1 savings with transferable contract. No need to recoup upfront investment if selling soon.
Fixed income, budget-conscious
PPA
Usage-based pricing with predictable rates. Pay only for what you produce and use.
High state incentives (NJ, MA)
Cash
Keep all incentive value. State programs partially replace federal credit, making cash more attractive.
Low state incentives (NH, ME)
Lease/PPA
Company ITC offsets lack of state programs. Their 30% credit provides more value than you can claim.
| Scenario | Best Option | Why |
|---|---|---|
| Strong credit, long-term home | Cash | Maximum 25-year return |
| Good credit, limited savings | Solar Loan | Own the system, $0 down |
| Selling home in 5–7 years | Lease or PPA | Day 1 savings, transferable |
| Fixed income, budget-conscious | PPA | Usage-based, predictable |
| High state incentives (NJ, MA) | Cash | Keep all incentive value |
| Low state incentives (NH, ME) | Lease/PPA | Company ITC offsets lack of state programs |
5 Common Mistakes Homeowners Make
- Ignoring dealer fees on solar loans. A 0% APR loan with 20% dealer fee has an effective cost higher than a 5% loan with no fee. Always compare total financed amount and true cost of capital.
- Assuming cash is always best. Without the federal credit, cash has a 9–13 year payback in many states. If you're selling in 10 years or can't afford to tie up $30,000+, lease/PPA may deliver better actual returns.
- Not modeling PPA escalators against utility rate growth. A PPA looks great year 1 but can become expensive by year 20 if utility rates grow slower than the PPA escalator. Run a 25-year projection.
- Overlooking ownership benefits. Cash and loan buyers qualify for home value increases (solar adds ~4% to resale value), state incentives, and SREC income. Lease/PPA buyers don't own the asset so don't capture these benefits.
- Choosing based on year-1 savings only. The lowest first-year cost isn't always the best 25-year value. Model cumulative savings over the system lifetime, factoring in loan interest, escalators, ownership benefits, and opportunity cost of upfront cash.
Compare Financing Options for Your Home
Get a personalized quote showing cash, loan, lease, and PPA options for your specific situation.