Loading NuWatt Energy...
We use your location to provide localized solar offers and incentives.
We serve MA, NH, CT, RI, ME, VT, NJ, PA, and TX
Loading NuWatt Energy...
NuWatt designs, installs, and manages solar, battery, heat pump, and EV charger systems across 9 states. One company, one warranty, one point of contact.
Get a Free Quote
Use our calculator, sizing tables, and step-by-step formula to determine the exact number of panels for your home.
7.6 kW
18 panels
Avg System
~$24,700
before incentives
Avg Cost
~325 sq ft
18 panels
Roof Space
10-12 yr
varies by state
Payback
Quick Answer
The average US home needs 18–22 solar panels (7.5–9.5 kW)to offset electricity usage. Your exact count depends on three factors: annual electricity consumption, your state’s peak sun hours, and the wattage of your panels. Use our calculator below for a personalized estimate.
Enter your monthly electric bill and select your state. The calculator uses your local peak sun hours and 430W panels with a 80% production factor to estimate your panel count.
Estimate how many panels your home needs based on your electricity usage and location.
4.5peak sun hrs · $3.15/W · $0.28/kWh
Estimated annual usage: 10,714 kWh
Planning to add? (optional)
Your Estimate
panels needed
kW system
sq ft roof
est. cost
Based on 430W panels · 4.5peak sun hours · $3.15/W in Massachusetts. No federal tax credit applied (Section 25D expired Dec 2025).
Free personalized design using your actual roof & utility data
Quick reference table for Northeast homeowners paying ~$0.28/kWh. Find your approximate monthly bill to see how many panels you need for a 100% offset.
| Monthly Bill | Annual kWh | Panels Needed | System Size | Est. Cost |
|---|---|---|---|---|
| $100/mo | 4,800 kWh | 10 panels | 4.3 kW | ~$13,330 |
| $150/mo | 7,200 kWh | 14 panels | 6 kW | ~$18,600 |
| $200/mo | 9,600 kWh | 19 panels | 8.2 kW | ~$25,420 |
| $250/moMost common | 12,000 kWh | 23 panels | 9.9 kW | ~$30,690 |
| $300/mo | 14,400 kWh | 28 panels | 12 kW | ~$37,200 |
| $400/mo | 19,200 kWh | 37 panels | 15.9 kW | ~$49,290 |
| $500/mo | 24,000 kWh | 46 panels | 19.8 kW | ~$61,380 |
System Size by Monthly Bill (Northeast, 4.5 peak sun hours, 430W panels). Costs at ~$3.10/W before state incentives. No federal tax credit available.
Walk through the exact math using a real Massachusetts example: a homeowner paying $280/month for electricity at $0.28/kWh.
Take your monthly electric bill, multiply by 12 months, then divide by your electricity rate to convert dollars to kWh.
$280/mo x 12 = $3,360/yr / $0.28/kWh = 12,000 kWh
Peak sun hours measure equivalent hours of full-intensity sunlight per day. This varies by region: Northeast gets 4.3-4.7 hours, Southwest gets 5.5-6.5 hours.
Massachusetts = 4.5 peak sun hours
Real-world systems lose 15-25% of theoretical output to inverter conversion, wiring resistance, soiling, temperature, and shading. We use 0.80 (20% loss) as a conservative but realistic factor.
Loss factor = 0.80 (conservative)
Divide annual kWh by the product of peak sun hours, 365 days, and the loss factor. This gives you the DC system size in kilowatts.
12,000 / (4.5 x 365 x 0.80) = 9.13 kW
Divide the system size in watts by the individual panel wattage. Round up to the nearest whole panel. Modern residential panels are typically 400-440 watts.
9,130W / 430W = 21.2 → 21 panels
Result for our MA example
A homeowner paying $280/month in Massachusetts needs a 9.1 kW system with 21 panels to offset 100% of their electricity usage. At $3.15/W, this system costs approximately $28,665 before state incentives. With SMART 3.0 production payments ($0.03/kWh for 20 years), net cost drops further.
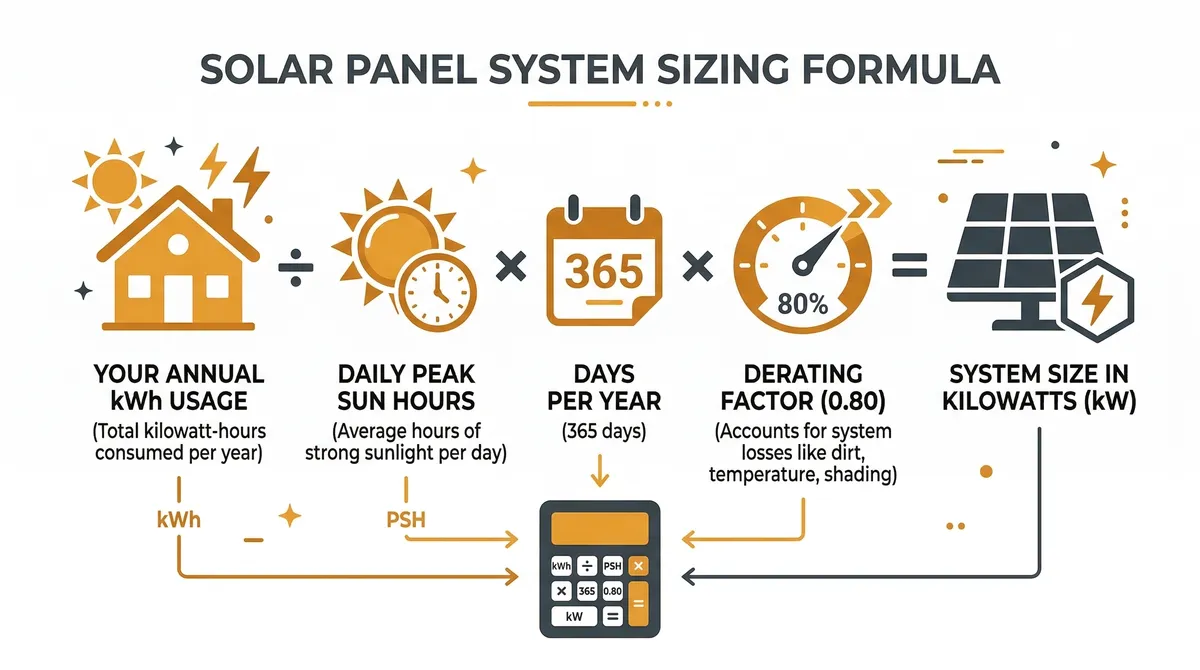
One formula works for any home in any state. Adjust the peak sun hours for your region.
System Size Formula
System kW = Annual kWh ÷ (Sun Hours × 365 × 0.80)
Then:
Panels = (System kW × 1000) ÷ Panel Wattage
The 0.80 Factor Explained
Real-world systems produce ~80% of their theoretical maximum. Losses come from inverter efficiency (~3%), wiring resistance (~2%), panel soiling (~3%), temperature derating (~5%), and miscellaneous (~7%). Using 0.80 builds in a safety margin so your system actually meets your needs.
Peak Sun Hours by Region
Panel counts vary significantly by state because of differences in sun exposure, electricity rates, and installation costs. Here is the data for a 10,000 kWh/year home.
| State | Peak Sun Hours | Cost/Watt | Electric Rate | Panels for 10,000 kWh | Est. System Cost |
|---|---|---|---|---|---|
| Massachusetts | 4.5 hrs/day | $3.15/W | $0.28/kWh | 18 panels | ~$24,381 |
| Connecticut | 4.5 hrs/day | $3.10/W | $0.27/kWh | 18 panels | ~$23,994 |
| Rhode Island | 4.6 hrs/day | $3.05/W | $0.29/kWh | 18 panels | ~$23,607 |
| New Hampshire | 4.4 hrs/day | $3.03/W | $0.27/kWh | 19 panels | ~$24,755 |
| New Jersey | 4.7 hrs/day | $3.00/W | $0.26/kWh | 17 panels | ~$21,930 |
| Maine | 4.5 hrs/day | $3.05/W | $0.27/kWh | 18 panels | ~$23,607 |
| Vermont | 4.3 hrs/day | $3.10/W | $0.22/kWh | 19 panels | ~$25,327 |
| Pennsylvania | 4.7 hrs/day | $3.05/W | $0.18/kWh | 17 panels | ~$22,295 |
| Texas | 5.5 hrs/day | $2.85/W | $0.15/kWh | 15 panels | ~$18,383 |
Based on 430W panels, 80% production factor, 10,000 kWh annual usage. Costs are before any state incentives. No federal tax credit available in 2026.
Why does Texas need fewer panels? Texas gets 5.5 peak sun hours per day compared to 4.5 in the Northeast, meaning each panel produces ~22% more electricity annually. However, Texas's lower electricity rate ($0.15/kWh) means the payback period is actually longer despite the lower system cost.
Your roof's orientation, pitch, and usable area directly impact how many panels you can install and how much electricity each one produces.
South
100%Optimal — full sun exposure all day
Southwest / Southeast
92%Near-optimal — slight morning or afternoon offset
East / West
82%Good — morning or afternoon sun only
North (steep pitch)
55%Poor — limited direct sun in northern hemisphere
Flat (tilted rack)
95%Excellent — adjustable tilt compensates for flat roof
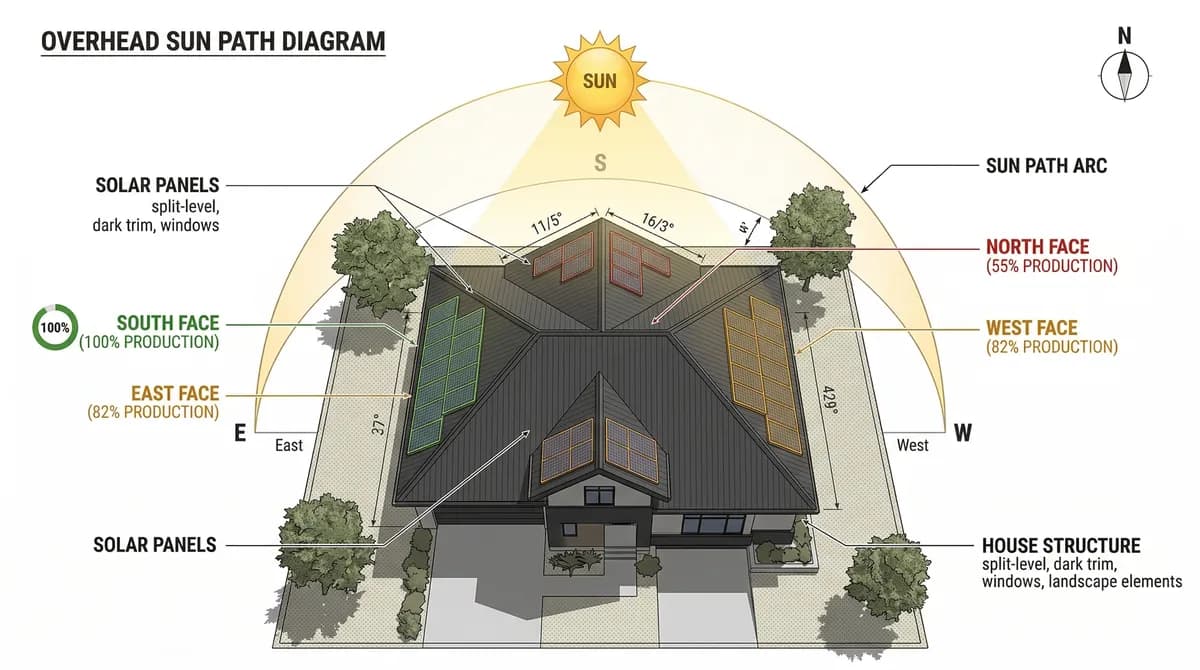
The ideal roof pitch for solar panels is 25–35 degrees (roughly a 6/12 to 8/12 slope), which matches the latitude of most US homes. Steeper roofs favor winter production; shallower roofs favor summer. Flat roofs use tilted racking systems that achieve 95% of optimal output.
Rule of thumb: Pitch has less impact than orientation. A 15-degree south-facing roof outproduces a 35-degree east-facing roof by ~15%.
Each modern solar panel occupies approximately 18 square feet (~21 sq ft including mounting clearances). You also need to account for fire code setbacks: typically 3 feet from the ridge and 18 inches from roof edges for firefighter access.
Quick math: 400 sq ft usable roof area / 21 sq ft per panel = ~19 panels maximum. Obstructions like dormers, vents, and chimneys reduce this further.
Shading is the single biggest performance killer for solar arrays. The type of inverter you use determines whether shade on one panel takes down an entire string or just that one panel.
−60%
production loss on shaded string
String inverters wire panels in series. When one panel is shaded, it becomes a bottleneck that reduces output for the entire stringof 8–12 panels. A single tree shadow can cut string output by 50–70%.
25-year cost of shading: ~$16,800 in lost production
−15%
production loss on shaded panel only
Microinverters operate each panel independently. When one panel is shaded, only that panel's output drops. The other 17–19 panels continue producing at full capacity. This is called parallel operation.
25-year cost of shading: ~$4,200 in lost production
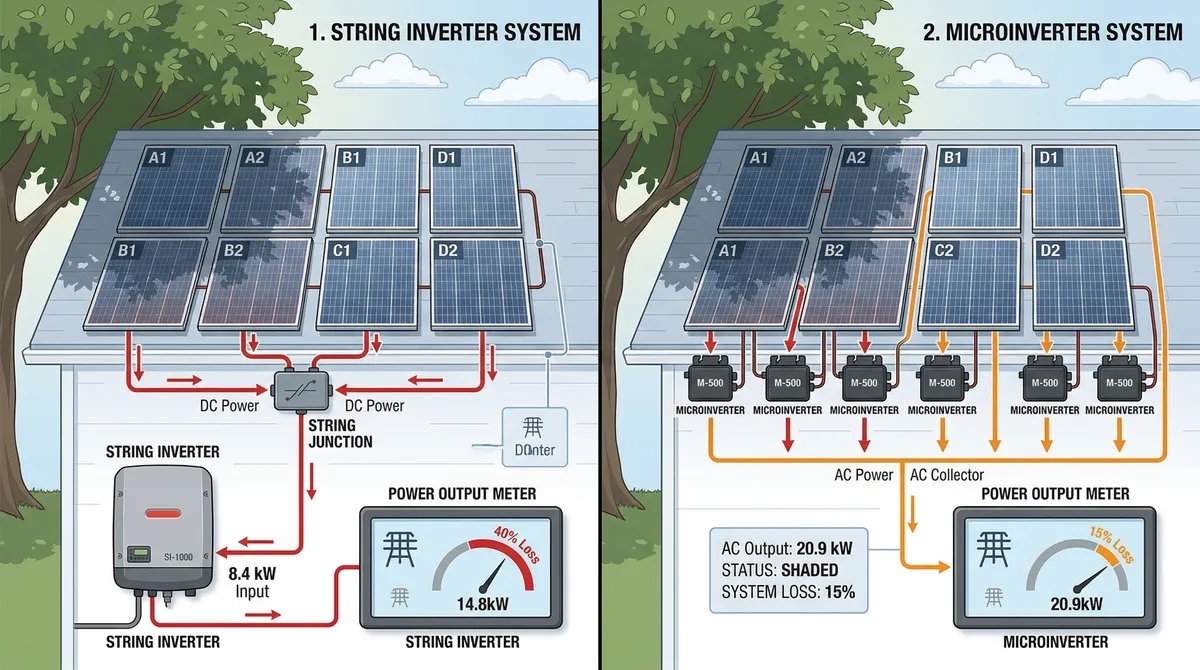
When to choose microinverters
If your roof has any shading from trees, chimneys, or neighboring structures for even part of the day, microinverters or power optimizers are strongly recommended. The 10–15% cost premium over string inverters is typically recovered within 3–5 years through better production. Most NuWatt installations include microinverters as standard.
Getting your panel count wrong costs real money. Here is what happens when you overshoot or undershoot.
Installing 30% more panels than needed sounds like “extra savings,” but excess electricity exported to the grid earns you wholesale credit rates in most states — typically $0.03–$0.05/kWh versus the $0.20–$0.30/kWh you pay for retail electricity.
Example: 30% oversize on a 10 kW system
Extra 3 kW cost: ~$9,300
Annual wholesale credit: ~$150–$250
Payback on excess: 37–62 years
Installing 30% fewer panels than needed means you still pay the utility for the gap. You bear the full installation cost (permitting, labor, racking) but miss 30% of the savings. Adding panels later costs significantly more due to a second mobilization, permitting, and interconnection.
Example: 30% undersize on a 10 kW system
You saved ~$6,500 upfront on fewer panels
But you lose ~$560/yr in utility bills you could have eliminated
25-year loss: ~$14,000+
When oversizing makes sense
If you plan to add an electric vehicle (2,500–4,000 kWh/year), heat pump (3,000–6,000 kWh/year), or heat pump water heater(1,500–2,500 kWh/year) within the next few years, it is significantly cheaper to install extra panels now. A second installation costs 30–50% more per watt due to repeated permitting, labor mobilization, and interconnection fees.
Electrification is accelerating. Here is how much additional solar capacity common upgrades require.
Install extra capacity now, not later
Adding panels to an existing system costs 30–50% more per watt than adding them during initial installation. You pay for a second permit, second crew visit, possible inverter upgrade, and a new utility interconnection application. If you plan any electrical upgrades in the next 5 years, size your solar system to include them now.
Solar production swings dramatically between summer and winter. Understanding this is critical to sizing your system correctly.
A 10 kW system in Massachusetts produces roughly 1,400 kWh in June but only about 400 kWh in December— a 3.5x difference. This is completely normal and expected. Longer days, higher sun angles, and warmer temperatures all contribute to summer peaks.
Example: 10 kW system in Massachusetts, monthly production
In summer, your system overproduces and sends excess to the grid, earning credits on your utility account. In winter, you draw those credits to cover the production shortfall. This is why you size for annual offset (100% of yearly kWh), not monthly offset. Most states settle net metering credits on a 12-month rolling basis.
A common mistake is sizing your system to cover your worstwinter month. This results in a system 3–4x larger than needed, wasting massive capital on excess production that earns pennies at wholesale rates in summer. Always size for annual production, not monthly minimums.
Snow impact: Snow covering panels temporarily reduces production, but panels at 25°+ pitch shed snow quickly. Annual production models already account for typical snow days in their sun-hour calculations. Clearing snow manually is generally not recommended — the risk of roof damage outweighs the 1–3% annual production gain.
Answers to the most common questions about solar panel sizing, costs, and installation.
Most U.S. homes need 15 to 25 solar panels to offset their electricity bill. The exact number depends on your monthly usage, roof orientation, local sun hours, and the wattage of the panels installed. A home using 10,000 kWh per year in a state with 4.5 peak sun hours typically needs about 20 panels rated at 430 watts each.
Divide your annual electricity usage (in kWh) by the product of your local peak sun hours, the panel wattage, 365 days, and a system loss factor of 0.80. For example: 10,000 kWh / (4.5 hrs x 0.430 kW x 365 x 0.80) = approximately 18 panels. Use the calculator above for a state-specific estimate.
Technically yes, but it is strongly discouraged for grid-tied residential systems. DIY installations void most manufacturer warranties, may not pass electrical inspection, and disqualify you from state incentive programs that require licensed installer certification. Additionally, working on rooftops with high-voltage DC wiring poses serious safety risks. Professional installation typically adds only 10-15% to total project cost.
Undersizing means you still pay a utility bill for the gap between production and usage. Oversizing depends on your state net metering policy — some states credit excess at full retail, others at a reduced rate, and some cap system size at 100-125% of annual usage. In most Northeast states, sizing to 100% of usage is the sweet spot.
Yes. Solar panels produce electricity from diffuse light, not just direct sunlight. States like Massachusetts and New Jersey rank in the top 10 nationally for solar installations despite having fewer peak sun hours than the Southwest. Higher electricity rates in the Northeast often make solar more financially attractive even with less sun.
Each modern 430-watt panel occupies about 18 square feet. A typical 20-panel system needs roughly 360 square feet of unshaded roof space. South-facing roofs are ideal, but east-west roofs still produce about 82% of maximum output. Obstructions like dormers, vents, and chimneys reduce usable area.
No. The Section 25D residential solar Investment Tax Credit (ITC) expired on December 31, 2025 and was not renewed. Homeowners who purchase solar in 2026 receive $0 in federal tax credits. However, the Section 48 commercial ITC still exists for third-party-owned systems (like Propel PPA financing) where the financing company — not the homeowner — claims the credit. State-level incentives (SMART, REF, ADI, net metering) remain available.
Not directly. A 3,000-square-foot home with energy-efficient appliances and good insulation may use less electricity than a 1,500-square-foot home with electric heat, an older AC, and a pool pump. Your actual electricity consumption (check your utility bill for annual kWh) is far more accurate than square footage for sizing a solar system.
Have more questions? Check our solar terminology guide or the truth about solar in 2026.
Our solar calculator uses your address and electric bill to determine the perfect system size for your home — accounting for your specific roof, shading, and local sun hours.
Or explore our solar terminology guide • solar panel cost guide