Loading NuWatt Energy...
We use your location to provide localized solar offers and incentives.
We serve MA, NH, CT, RI, ME, VT, NJ, PA, and TX
Loading NuWatt Energy...
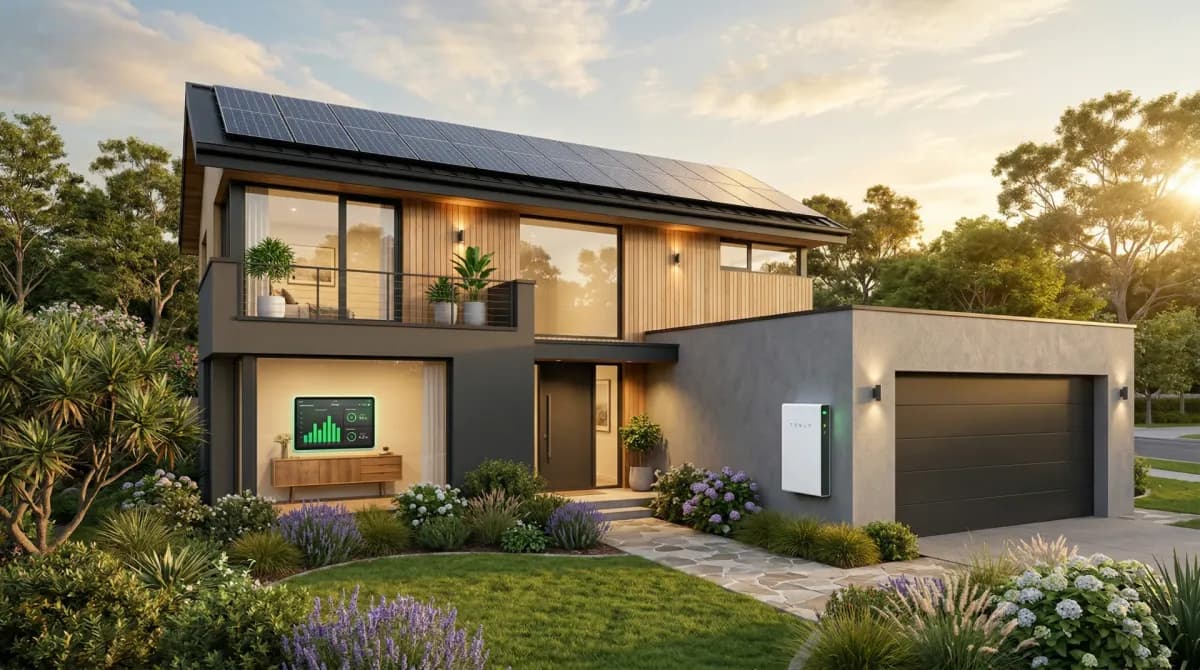
NuWatt designs, installs, and manages solar, battery, heat pump, and EV charger systems across 9 states. One company, one warranty, one point of contact.
Get a Free QuoteWhat 10+ years of ownership actually looks like — from Day 1 through decade milestones. No hype, no sales pitch. Just the real experience of living with solar panels and a home battery.
The day your solar panels go up is exciting — but it is just the beginning. Here is what actually happens, step by step, so nothing catches you off guard.
A crew of 3-5 installers arrives with all equipment pre-staged. They mount racking on your roof, attach panels, wire the system to a new inverter (usually in your garage or basement), and connect your battery if you have one. Most residential installs take 1-2 days. Larger systems or complex roofs may take 3.
Your local building inspector verifies the installation meets code. This is typically scheduled within a few days of completion. If anything needs adjustment, your installer handles it before resubmitting.
This is the part most people do not expect — waiting for your utility to approve the interconnection and install a bi-directional meter. Timelines vary widely: some utilities approve in a week, others take 4-6 weeks. Your system cannot export to the grid until this is complete.
The moment your system goes live, you will see your production meter climbing and your grid import dropping. If your panels produce more than you use, your meter literally runs in reverse (or your net meter shows a negative number). This is the moment most owners describe as "the best feeling."
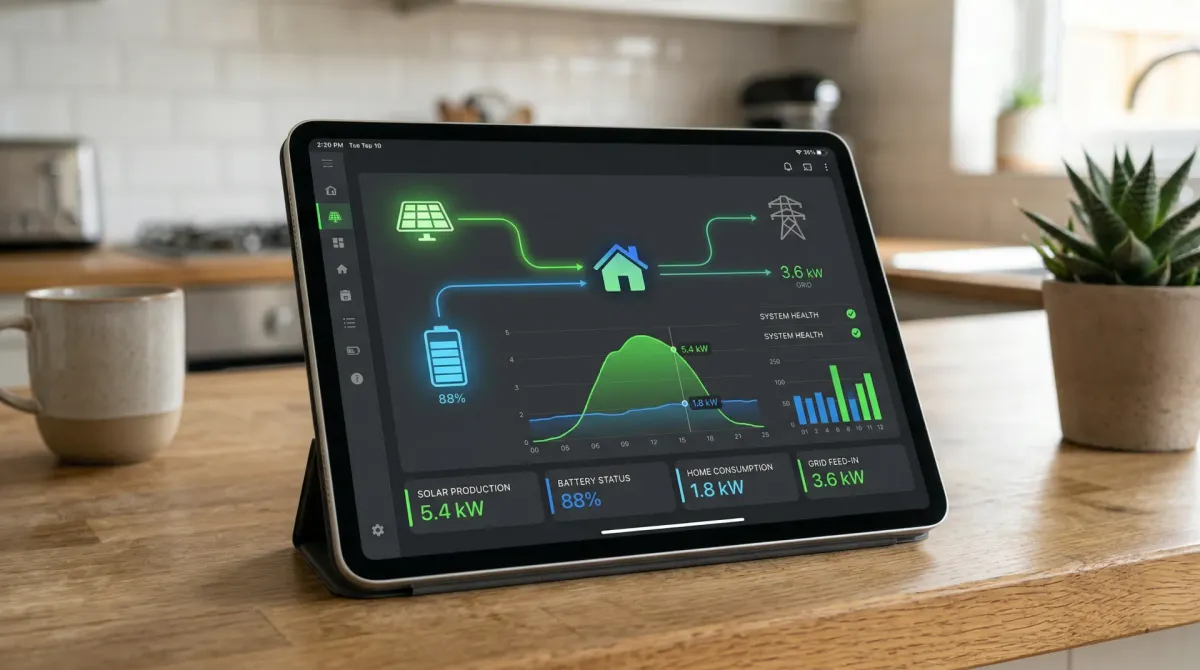
Your installer walks you through your monitoring app (Enphase Enlighten, SolarEdge, Tesla, or similar). You can see real-time production, consumption, battery state, and grid interaction from your phone. Most owners check it obsessively for the first few weeks — that is completely normal.
Pro Tip: The Interconnection Wait
The biggest surprise for new owners is the utility interconnection timeline. Your system may be physically installed and inspected, but you cannot legally turn it on until the utility approves. Ask your installer for a realistic timeline for your specific utility — it varies significantly even within the same state.
Your monitoring app becomes your energy command center. Here is what a typical day looks like and what each metric means.
Sunrise
Panels begin producing. Battery starts charging from solar instead of the grid.
Peak Production
System produces more than you use. Surplus charges battery, then exports to grid for net metering credits.
Evening Peak
Production drops. Battery kicks in to power your home during expensive peak hours. Grid import stays minimal.
Overnight
No solar production. Battery covers evening use, then grid takes over when battery reaches reserve level.
Daily Production (kWh)
Self-Consumption Ratio
Grid Export (kWh)
Battery Cycles
Solar production swings with the seasons — and that is completely normal. Understanding the seasonal rhythm helps you set realistic expectations and appreciate why net metering exists.
Production percentages shown are relative to your system's rated peak capacity. Annual production variance of +/-10% year to year is normal due to weather patterns.
Mar - May
Jun - Aug
Sep - Nov
Dec - Feb
Why net metering matters: In most states, the credits you bank during sunny summer months offset your winter bills. You are essentially using the grid as a seasonal battery — overproducing in June to cover December. Your annual net bill is what matters, not any single month.
New England averages 1,200-1,350 kWh per kW installed per year. But production is not evenly distributed — June produces roughly 3x what December does. Here is the month-by-month breakdown so you know exactly what to expect.
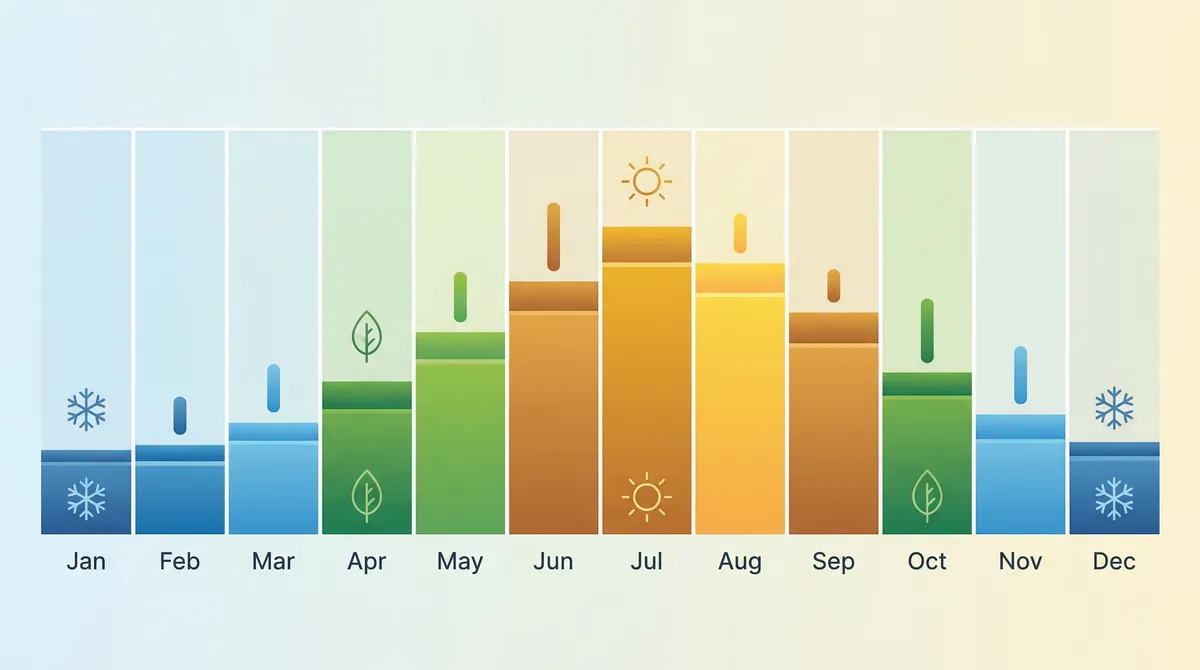
Jan
35%
Short days, low sun angle, snow
Feb
45%
Days lengthen, snow clears
Mar
65%
Spring ramp begins
Apr
85%
Strong shoulder month
May
95%
Near-peak, long days
Jun
100%
Peak production month
Jul
98%
Peak continues, humidity
Aug
90%
Late summer tapering
Sep
75%
Fall shoulder begins
Oct
60%
Shorter days, leaf shade
Nov
40%
Winter transition
Dec
30%
Winter minimum
Summer Strategy
Battery fully charges by midday. Afternoons: discharges during peak TOU rates. ConnectedSolutions demand response events (15-20 per summer) earn $225-275/kW. Battery cycles 1-1.5x daily.
Winter Strategy
Short days mean less surplus. Battery prioritizes self-consumption — storing midday solar for evening use rather than exporting. Backup reserve stays higher (storm season). Battery may only reach 60-80% charge on cloudy days.
Adding a battery transforms solar from "nice savings" into genuine energy independence. Here is what batteries actually do for you day-to-day.
If your utility charges different rates at different times (time-of-use pricing), your battery charges during cheap off-peak hours or from solar, then powers your home during expensive peak hours. In states like Massachusetts and Connecticut, the peak-to-off-peak spread can be $0.10-0.15 per kWh — adding $150-250 in annual savings on top of solar alone.
When the grid goes down, a battery-equipped system automatically islands — disconnecting from the utility and powering your home independently. A typical 13.5 kWh battery can run essential loads (refrigerator, lights, internet, phone charging, medical devices) for 10-24 hours depending on usage. With solar recharging during the day, some homeowners have run indefinitely during multi-day outages.
What a typical battery CAN power during an outage:
What typically CANNOT run on battery alone:
Modern inverters (Tesla Powerwall, Enphase IQ, Franklin WholHome) can detect incoming severe weather via internet weather services and automatically charge the battery to 100% before a storm arrives. This means maximum backup capacity exactly when you need it most, without you lifting a finger.
Like all lithium-ion batteries, home batteries lose capacity over time. Expect 70-80% of original capacity at the 10-year warranty mark. A 13.5 kWh battery will store approximately 9.5-10.8 kWh at year 10 — still very functional for daily cycling and outage backup. Degradation is gradual and predictable, not a sudden failure.
In several Northeast states, utilities pay you to share your battery capacity during peak grid demand events. Massachusetts ConnectedSolutions pays up to $275/kW of enrolled capacity per summer season. Rhode Island has a similar program at $225/kW. These payments can add $800-1,500 per year in revenue, significantly accelerating your battery payback.
Your battery is not just sitting there — it is actively managing energy flow 24 hours a day. Here is what a typical summer day looks like for a solar+battery home.
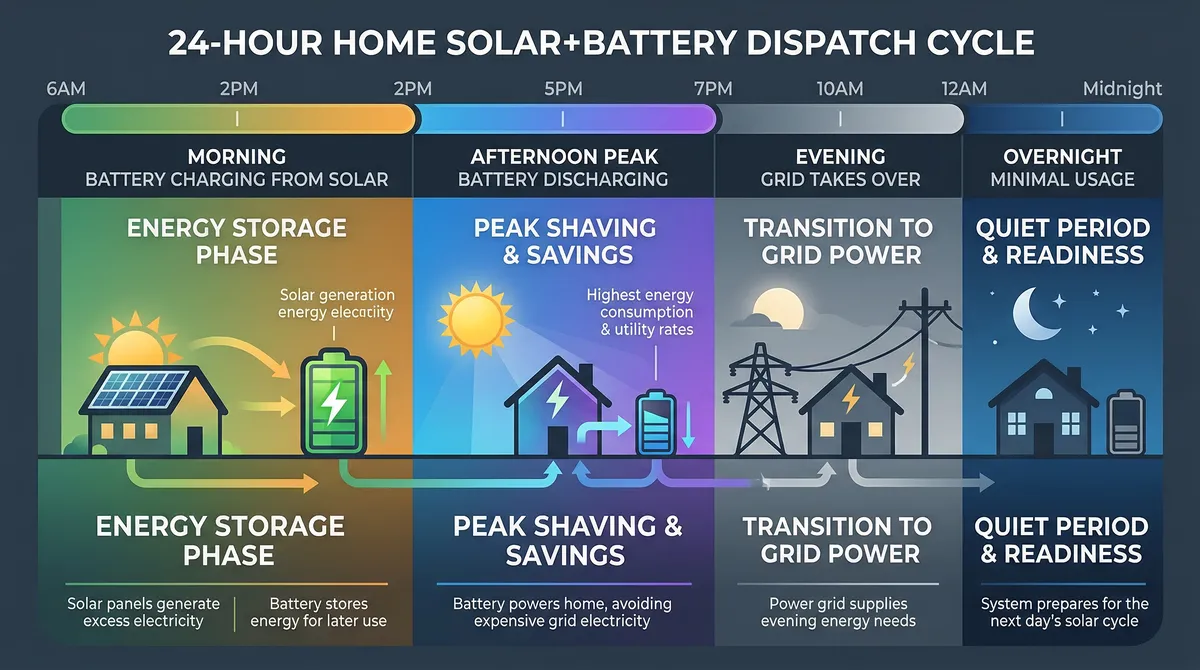
Solar production begins at sunrise. Battery starts charging from solar instead of drawing from the grid. Your home runs on a mix of solar and any remaining battery from overnight.
Production exceeds household demand. Battery charges to 100%. Excess solar exports to the grid, building net metering credits. Your grid import is zero during these hours.
This is when electricity is most expensive (time-of-use peak). Battery discharges to power your home during peak rates. Solar production drops as the sun lowers. Grid import stays minimal.
Solar production ends. Battery covers remaining evening use (cooking, TV, lights) until reaching its reserve threshold (typically 10-20% held for backup). Grid supplements as needed.
No solar production. Battery is at reserve level. Home draws from the grid at off-peak rates (the cheapest time). Some systems can charge from the grid overnight if TOU rates make it economical.
ConnectedSolutions Demand Response Events
During 15-20 summer peak events per year, your utility may call on your battery to discharge to the grid. These events typically last 2-3 hours during afternoon peaks. In Massachusetts, this earns $275/kW (Eversource) or $225/kW (National Grid). In Rhode Island, $225/kW. A 13.5 kW battery enrolled in ConnectedSolutions earns $800-1,500+ per summer season — paid automatically by the utility.
Storm Mode — Automatic Weather Response
When severe weather is forecast, modern battery systems (Tesla Powerwall, Enphase IQ, Franklin WholHome) automatically switch to Storm Watch mode. The battery charges to 100% and holds that charge instead of discharging for TOU arbitrage. If the grid goes down, you have maximum backup capacity ready. Once the weather clears, the system returns to normal dispatch automatically.
These scenarios represent typical experiences from homeowners across our service territory. Names are illustrative, but the numbers reflect real systems and real savings.
Sarah
Wellesley, MA
“Our Eversource bill was $340/month before solar. Now it is under $15 — just the connection fee. The ConnectedSolutions program pays us $275/kW each summer for our Powerwall. That is an extra $1,100/year for doing absolutely nothing. During the ice storm last January, we were the only house on our street with lights on for three days.”
Mike
Portland, ME
“We were spending $4,200 a year on heating oil at $3.82 a gallon. Our installer sized the solar to cover both the house and two Mitsubishi heat pumps. First winter, our total energy cost — electricity plus the tiny amount of oil we used on the coldest days — was $1,800. That is $2,400 saved in year one, and oil keeps going up.”
Linda & Tom
Milford, CT
“We financed through the CT Green Bank Smart-E program at 6.99% APR for solar. Our monthly loan payment is $195, but our Eversource bill dropped by $210. We are cash-flow positive from month one — $15 ahead every month, and the RRES net metering credits cover nearly all our usage. After the loan is paid off, it is all savings.”
Priya
Edison, NJ
“The SREC-II income caught me by surprise. Every megawatt-hour we generate earns $85.00 in ADI payments — locked in for 15 years. Our system produces about 13.5 MWh a year, so that is roughly $1,160 annually on top of the electric bill savings. It turned a good investment into a great one.”
James
Austin, TX
“We went with Propel because we did not want a big upfront cost and there is no residential tax credit anymore. Fixed monthly payment, and we own the system free and clear in year 5. Our summer electric bills used to hit $380 with the A/C running nonstop. Now our combined solar payment plus remaining electric is about $220.”
Transparency note: These are representative scenarios based on typical system sizes and local utility rates. Individual results vary based on roof orientation, shading, energy usage patterns, and utility rate changes. All savings figures reflect post-ITC economics (no federal residential solar tax credit).
One of the best things about solar? It requires almost no maintenance. Panels have no moving parts, no fluids to change, no filters to replace. Here is what you actually need to do (and what you can skip).
| Task | Frequency |
|---|---|
| Panel Cleaning | Rarely needed |
| Snow Removal | Not recommended |
| Monitoring Check | Monthly |
| Annual Production Review | Yearly |
| Visual Roof Inspection | Yearly |
| Inverter Replacement | Once at year 10-15 |
| Battery Health Check | Yearly (via app) |
25 years
Solar Panels
80% output guaranteed
12-25 years
Inverters
Microinverters 25yr, string 12-15yr
10 years
Batteries
70-80% capacity guaranteed
Panel Degradation in Real Terms
A panel rated at 440W will typically produce around 420W at year 10 and 385W at year 25. That 0.3-0.5% annual degradation sounds abstract until you do the math: a 10 kW system producing 12,000 kWh in year 1 will still produce about 10,500 kWh in year 25. The panels do not "die" at 25 years — that is just when the warranty expires. Many systems continue producing well into their 30s and 40s.
Solar is a 25+ year investment. Here is how the ownership experience evolves over time — and when the major financial milestones happen.
Installation takes 1-3 days, but utility interconnection adds 2-6 weeks. Once live, you get your first real bill — and for many owners, it is $0 or a credit. You learn your monitoring app, watch your production curve obsessively, and realize that sunny days feel different when they are making you money. Your first full year of production data becomes your baseline for every year after.
If you are in NJ or MA, your first SREC/ADI payment cycle arrives — a check you may not have been expecting. You now understand the seasonal production swing: summer overproduction banks credits for winter. You stop worrying about cloudy weeks because you have seen the annual pattern play out. The monitoring app gets checked weekly instead of hourly.
If you financed with Propel, you now own your system outright. Traditional loan owners are halfway through their term. Cumulative savings have reached $12,000-$18,000. You have weathered multiple storms with your battery, and the generator you almost bought is still in the store. Your neighbors who waited are now paying 15-20% more for electricity than when you locked in.
String inverter owners may need their one replacement ($1,500-2,500). Microinverter owners: nothing to do. Battery warranties hit year 10 — most batteries still retain 75-80% capacity. Your panels are producing 95-97% of their original output. Cumulative savings: $25,000-$35,000. Everything from here is pure profit territory.
Panels have degraded 4-5% — barely noticeable in annual production. Some owners add a second battery (prices have dropped substantially by now) or upgrade their original unit. SREC/ADI contracts complete their 15-year term. Cumulative savings: $40,000-$55,000. Your system now powers a house with different appliances, maybe an EV, and potentially heat pumps that did not exist when you installed.
Two full decades of reliable electricity. Panels produce 87-90% of their day-one output. Cumulative savings: $55,000-$75,000. If you financed, the loan has been paid off for years. Your home value is $15,000-$20,000 higher. The solar industry has changed dramatically, but your panels keep doing what they have always done.
Manufacturer warranties expire, but panels do not stop working. Real-world data shows many systems still producing 80-85% of original capacity at 30+ years. You can keep using them, replace with more efficient next-generation panels, or simply enjoy decades of continued free power. Cumulative lifetime savings often exceed $80,000-$100,000.
These are the things that do not show up in sales presentations or marketing brochures. None of them are dealbreakers — but knowing about them upfront makes you a better-prepared owner.
Solar panels are dark glass mounted at an angle. They absorb heat from even weak winter sunlight and warm up faster than your roof. Snow slides off within a day or two in most cases. Scraping risks scratching the anti-reflective coating. Just let nature handle it.
Every new owner checks their app 10+ times a day for the first month. You will watch your production curve like it is a stock ticker. By month three, you check weekly. By year two, you barely look unless your monthly email summary flags something. This progression is universal.
Be prepared to become the block solar expert. Neighbors will ask what it cost, how much you save, whether it works in winter, and who your installer was. Some owners find it gratifying — others print out a one-page FAQ sheet and tape it to the fridge for visitors.
The gap between your panels and roof is warm, dry, and sheltered — perfect nesting habitat. Squirrels, birds, and occasionally raccoons will try to set up shop under your panels. Critter guards (metal mesh around panel edges) cost $500-1,200 at install and are worth every penny.
A tree that does not shade your panels today might shade them in 10 years. Trees grow 1-2 feet per year on average. Your installer should flag trees that are on a trajectory to shade your array. Periodic trimming (every 3-5 years) is much cheaper than lost production.
If your roof needs replacing in the next 5-10 years, do it before solar goes up. Removing and reinstalling solar panels to replace a roof costs $3,000-5,000. Most installers will inspect your roof condition and advise you honestly — a good installer will tell you to re-roof first if it is due.
The honest truth about solar ownership
Solar panels are boring in the best possible way. After the initial excitement, they just quietly work — producing electricity, reducing your bills, and adding value to your home. The maintenance is minimal, the technology is proven, and the savings are real. The things above are minor compared to 25+ years of reliable, predictable energy production.
After working with homeowners through 10+ years of solar ownership, here is the honest financial picture — no sugar coating, no federal tax credit to lean on. Just the raw numbers.
$200-300/mo
Typical Monthly Savings
8-12 kW system, NE rates
$48K-72K
20-Year Cumulative Savings
Without federal credit
$15-20K
Added Home Value
Berkeley Lab research
8-12 yrs
Typical Payback Period
Post-ITC, varies by state
The electric bill relief is real and immediate
Most owners see their bill drop by 70-90% in the first full year. In states like Massachusetts with high rates ($0.28/kWh+), savings are substantial from day one.
Energy independence feels better than the savings
Battery owners consistently report that the peace of mind during storms and outages is worth more to them than the financial return. Not needing a generator, not losing food, not sitting in the dark — it changes your relationship with weather events.
Home value increase is well documented
Berkeley Lab's research across 28,000+ home sales found solar adds an average of $15,000-$20,000 to home sale price for systems that are owned (not leased). In high-rate states, the premium is even higher.
Payback takes longer without the ITC — plan accordingly
With the residential solar tax credit (Section 25D) expired as of January 2026, payback periods are longer than what you may have seen quoted historically. The 8-12 year range is honest for most Northeast homeowners today. But panels last 25-40+ years — there is still 15-30 years of pure profit after payback.
Solar savings vary significantly by state. Check our state-specific guides for precise numbers in your area.