Loading NuWatt Energy...

We use your location to provide localized solar offers and incentives.
We serve MA, NH, CT, RI, ME, VT, NJ, PA, and TX
Loading NuWatt Energy...
Use the free estimator for a preliminary layout, or share your preferred response method with the commercial team. Final feasibility still requires site, utility, and engineering review.
Five modeled commercial solar planning scenarios with cost, incentive, payback, and financing assumptions for warehouse, school, hospital, retail, and municipal projects.
Warehouse
200 kW
Cash: 2.6yr payback
School
150 kW
PPA: $0 upfront
Hospital
500 kW
40% ITC + battery
Retail
100 kW
Carport + EV
Municipal
250 kW
Direct Pay ITC
Five modeled MA planning scenarios illustrate how system size, ownership, tariffs, and documented incentive eligibility can change project economics. The examples cover a warehouse, school, hospital, retail carport, and municipal ground mount. They use current market assumptions but are not verified NuWatt customer projects or guaranteed outcomes. A project-specific result requires a site, bill, utility tariff, financing, and tax-eligibility review.
Modeled scenario disclosure
The profiles below are planning scenarios built from current market pricing, utility, incentive, and production assumptions. They are not verified NuWatt customer projects or guaranteed outcomes. A real proposal requires site, structural, utility, interconnection, financing, and tax-eligibility review.
Commercial solar economics vary dramatically by building type, system size, financing structure, and incentive eligibility. These five modeled scenarios represent common Massachusetts project archetypes and illustrate how assumptions can change a preliminary result.
Each scenario uses Massachusetts planning inputs for installed cost, electricity rates, SMART eligibility, and federal tax assumptions. None of those inputs is guaranteed for a specific site. For a customized preliminary analysis, use our Commercial Solar IRR Calculator, then verify the result through site, utility, financing, and tax review.
200 kW Rooftop — Cash Purchase
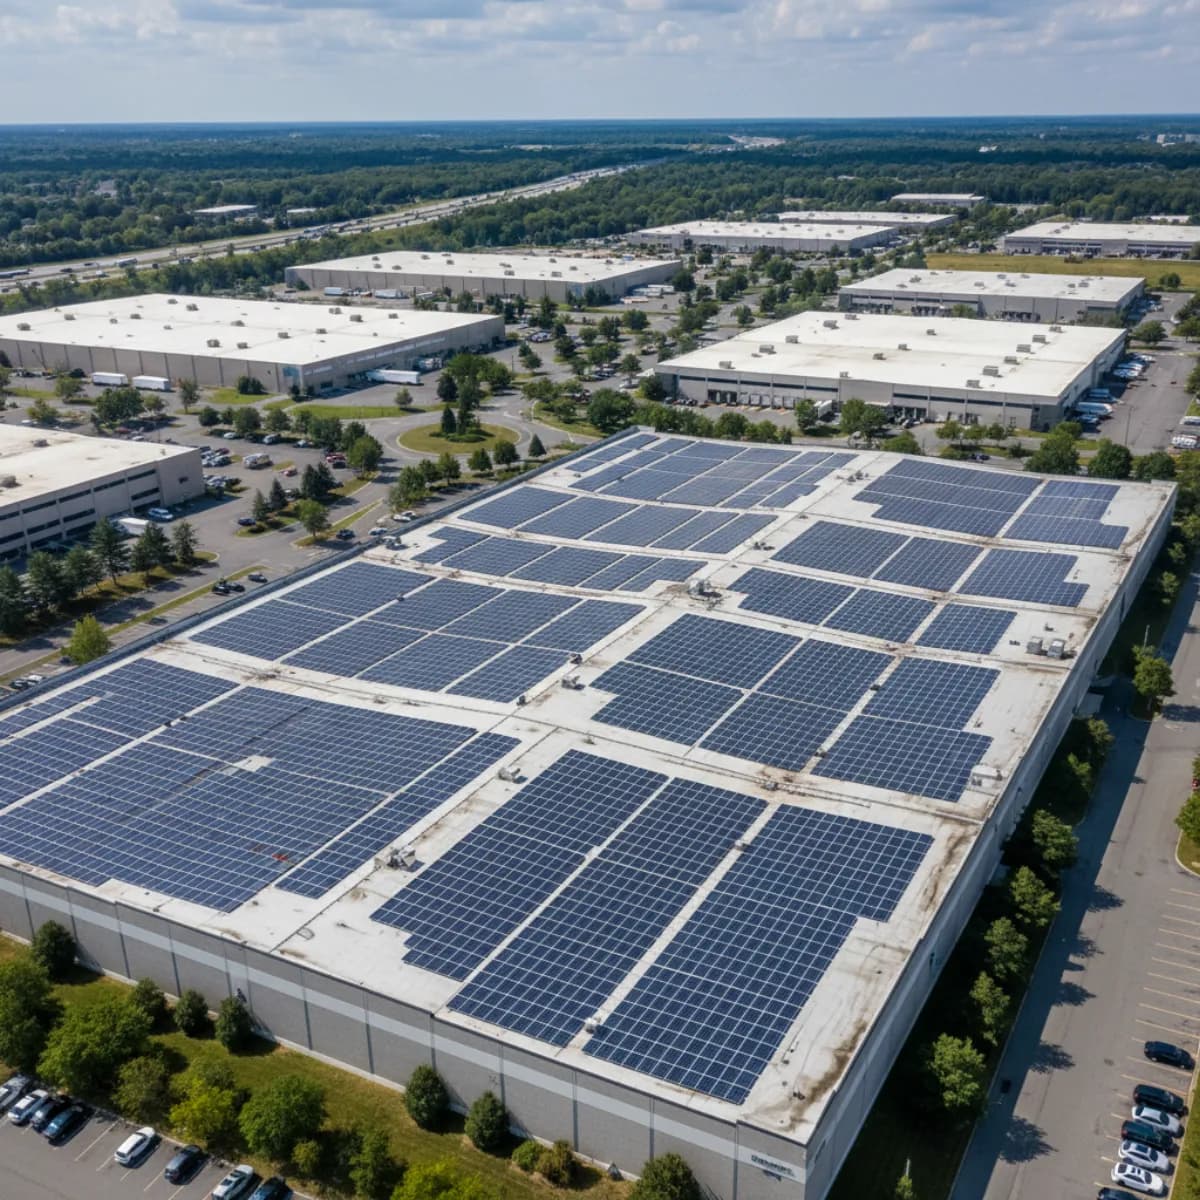
Before Solar
After Solar
150 kW Rooftop — PPA Model

Before Solar
After Solar
500 kW Rooftop + Battery — Energy Community Bonus
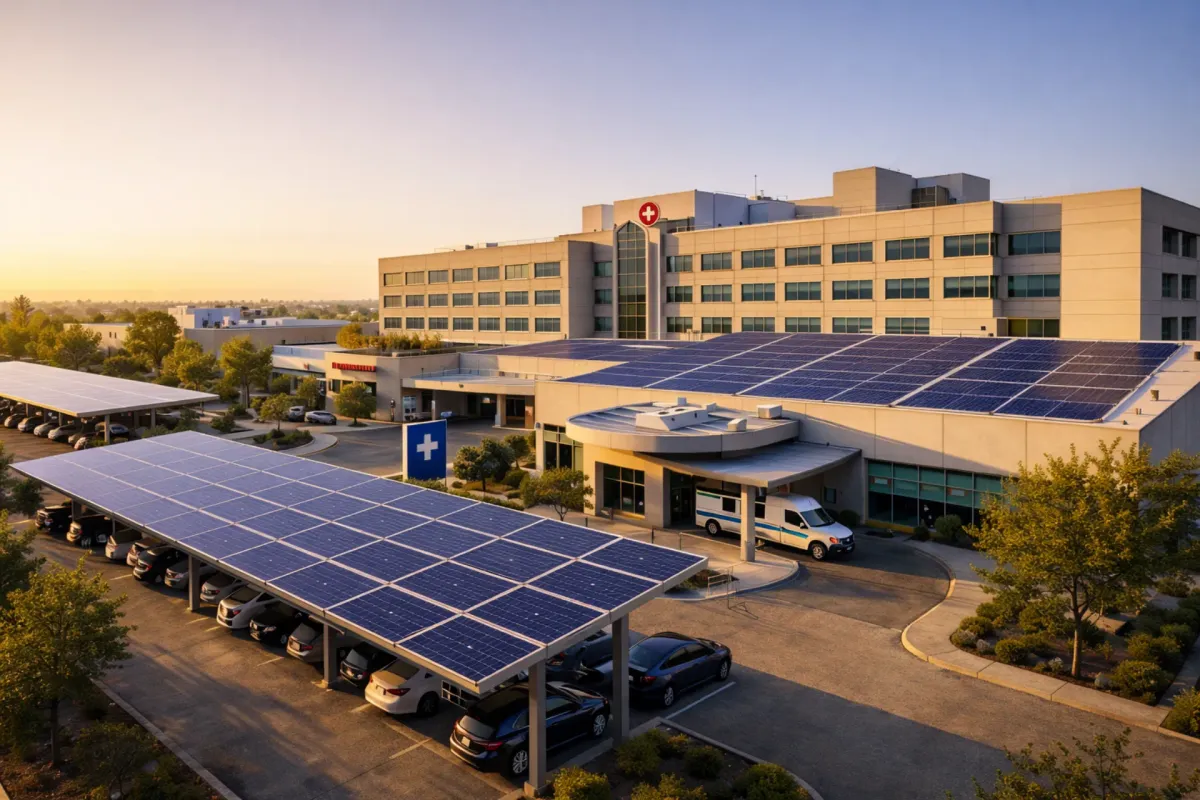
Before Solar
After Solar
100 kW Carport — SMART Canopy Adder + EV Charging

Before Solar
After Solar
250 kW Ground Mount — Direct Pay + Green Communities Grant

Before Solar
After Solar
Across all five case studies, several patterns emerge that apply broadly to Massachusetts commercial solar projects in 2026.
For-profit entities with tax appetite maximize returns through cash or loan financing, capturing both ITC and MACRS directly. Nonprofits and municipalities optimize through PPAs (Newton School) or Direct Pay (Amherst Municipal). The best financing choice depends entirely on the entity tax situation, not the project itself.
The SMART canopy adder ($0.06/kWh, Cape Cod Retail) and battery adder ($0.04/kWh, Springfield Hospital) add hundreds of thousands of dollars in lifetime revenue. These adders are the difference between a good investment and an exceptional one. Always evaluate which adders your project qualifies for during the design phase.
With commercial rates of $0.22-$0.30/kWh, Massachusetts solar systems offset more expensive electricity than projects in most other states. Combined with the full federal incentive stack, this creates payback periods of 2-4 years — among the best commercial solar economics in the country.
The Springfield Hospital case study shows that battery storage provides demand charge reduction ($30,000/year), SMART battery adder ($0.04/kWh for 20 years), ConnectedSolutions payments ($8,000/year), and backup power value. For facilities with high demand charges, battery storage can be the highest-ROI component of the system.
All five projects took 8-14 months from assessment to PTO. Projects that began construction on or before July 4, 2026 locked in the most flexible Section 48E timing (the 100% MACRS bonus is permanent under OBBBA); projects starting now still qualify if they are placed in service by December 31, 2027. Our Commercial Solar Project Timeline guide provides detailed phase-by-phase planning guidance.
In these modeled Massachusetts scenarios, cash-purchase payback estimates range from 2-4 years when the stated ITC, MACRS, SMART, tax, tariff, and production assumptions are all met. PPA and lease structures can offer immediate operating savings with zero upfront cost but lower long-term returns because the system owner captures the tax benefits. Actual payback requires project-specific pricing, utility data, and verified incentive eligibility.
Get a custom analysis based on your building, utility territory, and tax situation. We handle every phase from assessment to PTO.