Loading NuWatt Energy...
We use your location to provide localized solar offers and incentives.
We serve MA, NH, CT, RI, ME, VT, NJ, PA, and TX
Loading NuWatt Energy...
NuWatt designs, installs, and manages solar, battery, heat pump, and EV charger systems across 9 states. One company, one warranty, one point of contact.
Get a Free QuoteSource: NuWatt Energy field data from 2,800+ system inspections across 9 states (2024-2026)
Complete troubleshooting guide — from checking your monitoring app to knowing exactly when to call a professional. Stop guessing and start diagnosing.
Every solar system has a production estimate — the number your installer provided when you signed. That estimate is your benchmark. But you need to understand two critical nuances before comparing actual vs. expected production:
If your actual production is more than 10% below the expected monthly output for 2 or more consecutive months, it is time to investigate. A single low month could be unusual weather. Two consecutive low months suggest a real problem.
Where to find your expected production:Check your installation contract, your monitoring app's “expected” line, or your installer's original proposal. If you cannot find it, run your address through PVWatts (free NREL tool) using your system size and roof orientation.
Normal Variance
Less than 5%
Weather, haze, and daily variation. No action needed.
Investigate
5-15% below
Could be soiling, minor shading, or calibration. Try cleaning first.
Problem
15%+ below
Equipment failure, major shading, or design error. Call a professional.
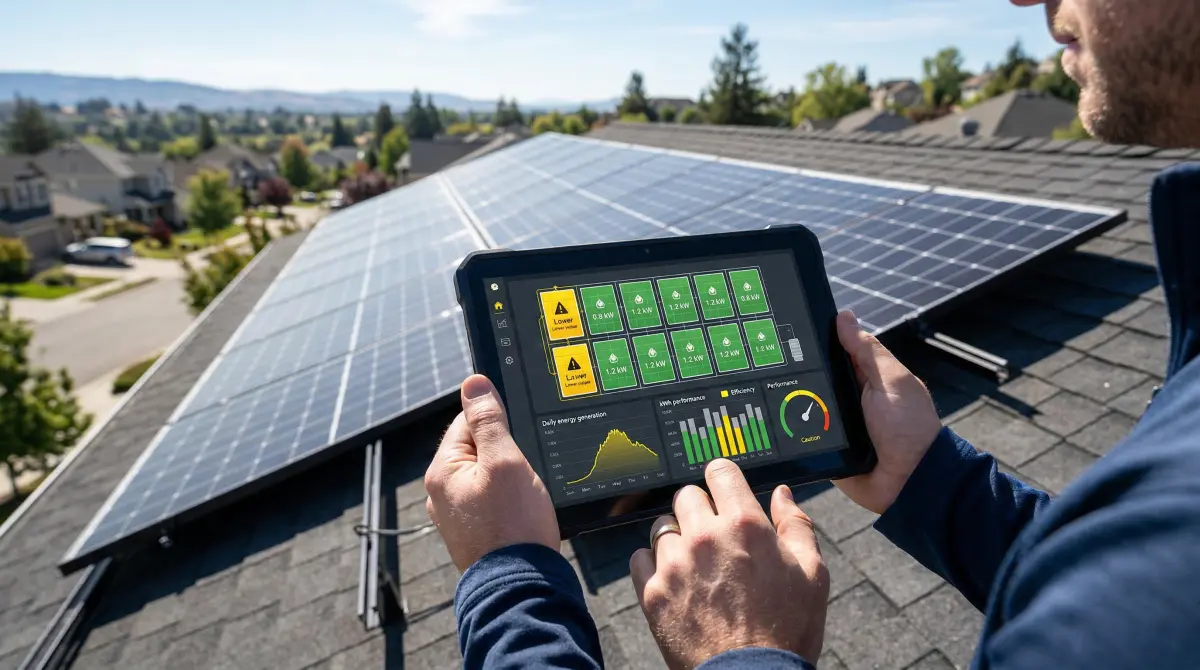
Your monitoring app is the single most important diagnostic tool. It tells you exactly what is happening at the panel level, string level, and system level. Here is what to check on each platform:
If your installer set up monitoring under their account and you don't have login credentials, contact the monitoring platform directly (Enphase, SolarEdge, etc.) with your system serial number to claim your account. This is your data — you own it regardless of your relationship with the installer.
Solar production varies dramatically by season. Before concluding your system has a problem, check whether your current month is simply a low-production season. Use these tables to see what percentage of your annual production each month should deliver.
| Month | % of Annual Total | Notes |
|---|---|---|
| January | 4-5% | Lowest — short days, snow cover |
| February | 5-6% | Slightly better, days lengthening |
| March | 7-8% | Spring equinox, production ramps |
| April | 9-10% | Strong month, ideal temps |
| May | 10-11% | Peak starts, long days |
| June | 11-12% | Summer solstice, highest production |
| July | 11-12% | Peak continues, heat may reduce slightly |
| August | 10-11% | Still strong, days shortening |
| September | 8-9% | Fall equinox, reliable output |
| October | 6-7% | Declining, leaf cover possible |
| November | 4-5% | Low production, short days |
| December | 3-4% | Annual minimum — this is normal |
| Month | % of Annual Total | Notes |
|---|---|---|
| January | 6-7% | Mild winter, decent production |
| February | 6-7% | Days lengthening quickly |
| March | 8-9% | Spring ramp-up, ideal temps |
| April | 9-10% | Strong production, before heat |
| May | 10-11% | Excellent — long days, warm |
| June | 10-11% | Peak month, longest days |
| July | 10-11% | Peak continues, extreme heat reduces slightly |
| August | 10-11% | Still strong, heat efficiency loss |
| September | 8-9% | Transitioning, still warm |
| October | 7-8% | Cooling temps improve efficiency |
| November | 6-7% | Shorter days but mild |
| December | 5-6% | Lowest — still better than Northeast |
We get calls every January from worried homeowners whose December production was “terrible.” In the Northeast, December and January produce only 3-5% of your annual total each. A 10 kW system producing 8,500 kWh/year will only generate 250-425 kWh in December. That is by design — your system makes up for it with 900-1,020 kWh in June and July. Judge your system on its full-year total, not a single winter month.
Based on 2,800+ system inspections across 9 states, here are the most common reasons solar systems underperform — ranked by how often we see them in the field.
New tree growth, a neighbor's addition, or a new building can cast shadows that didn't exist when your system was designed. Even partial shade on a single panel can reduce string output by 30-80% with string inverters.
Diagnostic Steps:
Fix: Tree trimming, panel-level optimizers, or microinverter upgrade to isolate shaded panels.
Dust, pollen, bird droppings, leaves, and snow accumulate on panels. In most climates, rain handles routine cleaning. But in dry areas, near farms, or under roosting birds, soiling can cut production by 5-25%.
Diagnostic Steps:
Fix: Hose off from ground level (never pressure wash). For stubborn spots, use a soft brush with mild soap. Commercial critter guards prevent bird nesting.
The inverter is the workhorse of your system — it converts DC power from panels into AC power for your home. Inverter failures are the most common hardware issue. String inverters have a 10-15 year lifespan; microinverters last 20-25 years.
Diagnostic Steps:
Fix: Try a power cycle (AC disconnect off, wait 60 seconds, back on). If error persists, warranty claim or replacement needed. Consider upgrading to microinverters.
Hail, fallen branches, thermal stress, and manufacturing defects can crack cells or delaminate panels. Hot spots from cracked cells reduce output and can be a fire hazard. Most panel warranties cover manufacturing defects for 25 years.
Diagnostic Steps:
Fix: File a warranty claim with the panel manufacturer. If out of warranty, replacement panels are $150-$400 each plus labor. A professional thermal scan can identify hot spots.
MC4 connectors can corrode, loosen, or melt over time — especially in humid, coastal, or extreme temperature environments. Rodents chew through wiring. These issues cause intermittent drops or complete panel/string failures.
Diagnostic Steps:
Fix: Professional inspection required. Repairing MC4 connectors involves working with live DC circuits. Add critter guards to prevent future rodent damage.
All solar panels degrade over time. Modern panels lose 0.25-0.5% output per year. After 25 years, a panel warranted at 80% should still produce at or above 87.5%. This is gradual — you should NOT see sudden drops from degradation alone.
Diagnostic Steps:
Fix: Normal degradation requires no action. If decline is excessive, file a warranty claim. For 15+ year old systems producing below warranty levels, consider panel replacement with modern higher-efficiency modules.
Your solar may be producing fine, but a faulty meter could under-count your exports. Old analog meters may run backward (in your favor), but digital net meters can malfunction, losing credits. Some meters weren't configured for bidirectional flow.
Diagnostic Steps:
Fix: Contact your utility company to test or replace the meter. If credits were undercounted, utilities are required to back-credit you in most states.
Some installers use optimistic assumptions — no shading, perfect tilt, inflated sun hours — to make proposals look attractive. If your system never hit its Year 1 estimate, the problem may be the estimate, not the equipment.
Diagnostic Steps:
Fix: Run your own estimate on PVWatts.nrel.gov. If the proposal was significantly off, you may have grounds for a warranty or performance guarantee claim. Document everything.
Not every issue requires a service call. Use this decision guide to determine whether you can handle the issue yourself or need professional help.
Snow or leaves on panels
DIYDIY — safe ground-level clearing only
Single panel output low
ProfessionalCall a pro — could be panel, connector, or optimizer issue
All panels producing low
Check FirstCheck inverter first, then call a pro if no error codes
Error codes on inverter or app
UrgentCall a professional immediately — do not attempt DIY repair
Gradual decline over months
Try DIYClean panels first. If no improvement after rain/cleaning, call a pro
System producing zero — total blackout
UrgentCheck main breaker and AC disconnect. If on, call a pro
Solar panels produce DC electricity whenever sunlight hits them — they cannot be turned off. Never touch exposed wiring, open junction boxes, or work on panels while they are on the roof. DC electricity is more dangerous than AC at the same voltage. All wiring, connector, and electrical repairs must be performed by a licensed professional with proper safety equipment and lockout/tagout procedures.
A comprehensive solar diagnostic costs $200-$500 depending on system size and location. Here is what a professional inspection covers and why each step matters.
A thermal camera identifies hot spots from cracked cells, loose connections, or diode failures. Hot spots above 30C differential indicate serious issues that reduce output and pose fire risk.
Measures the current-voltage characteristics of each panel. Compares actual output curves to manufacturer specs. Identifies degradation, mismatch, or partial shading with precision.
Tests voltage and current at each string to identify which circuit is underperforming. Can pinpoint a single failed panel, connector, or optimizer within a larger array.
Uses a Solar Pathfinder, SunEye, or drone-based LiDAR to map shade patterns across all seasons. Quantifies exactly how much production shading costs you annually.
Full inspection of inverter operation, error logs, AC/DC disconnect switches, wiring integrity, grounding, and code compliance. Checks for loose connections, corrosion, and rodent damage.
Pro tip: Many issues discovered during a diagnostic are covered under existing panel or inverter warranties. A $300 diagnostic that identifies a warranted inverter defect can save you $2,000-$4,000 in replacement costs. Always check warranty status before paying for repairs.
Sometimes the most cost-effective solution is not repair — it is upgrading to modern equipment that produces significantly more power per panel. Consider upgrading if:
Modern panels produce 30-40% more per panel than 2010-era modules. Replacement panels (440-470W) vs. old (250-310W) dramatically increase output.
If your central inverter died, consider upgrading to microinverters instead of replacing 1-for-1. Microinverters isolate each panel and eliminate single-point-of-failure risk.
If 3+ panels need replacement, the labor cost of panel-by-panel swaps may approach a full re-roof with new panels. Get quotes for both approaches.
If tree removal is not an option, fewer modern high-efficiency panels with microinverters can produce the same total output from the remaining unshaded area.
Keep in mind: the federal residential solar tax credit (Section 25D) expired on December 31, 2025. Replacement panels and new systems no longer receive a 30% federal credit. State incentives and third-party financing options like Propel (Section 48E) may still provide savings. Contact NuWatt for a current cost analysis.
Hundreds of solar installers have closed, merged, or gone bankrupt in the last two years. If your installer is gone, you are what the industry calls a “solar orphan.” Your system still works, but you have no one to call for monitoring, maintenance, warranty claims, or troubleshooting.
Contact Enphase, SolarEdge, or your inverter manufacturer directly with your system serial number to claim your monitoring account.
Panel warranties (25 years) and inverter warranties (12-25 years) survive installer bankruptcy. Find your equipment serial numbers for warranty claims.
Any NABCEP-certified installer can service your system. You need someone who will adopt your system for ongoing support — not just one-off repairs.
We adopt orphaned solar systems across New England, NJ, NY, PA, and TX. Full diagnostic, monitoring transfer, and ongoing maintenance included.
Compare your actual monthly production (from your monitoring app) to your installer's Year 1 estimate, adjusted for seasonal variation. If you're more than 10% below the expected monthly production for 2 or more consecutive months, investigate. Also run your address through the free PVWatts calculator at pvwatts.nrel.gov for an independent benchmark.
Yes. In the Northeast, December production is typically only 3-4% of your annual total, while June is 11-12%. A system producing 300 kWh in June might only produce 80-100 kWh in December. This is completely normal due to shorter days, lower sun angle, and occasional snow cover. Don't panic about winter production — judge your system on its annual total.
In most climates, rain handles routine cleaning. However, if you're in a dry area, near farmland, or have bird roosting issues, cleaning can recover 5-15% of lost production. Only clean from ground level with a garden hose. Never pressure wash, use abrasive chemicals, or walk on panels. If panels are inaccessible, hire a professional cleaning service ($150-$300).
Common codes include ground fault (isolation failure between DC and ground), arc fault (loose connection detected), grid fault (utility power issue), and over-temperature. Most inverter apps explain the specific code. Try a power cycle first: turn off AC disconnect, wait 60 seconds, turn back on. If the error recurs, contact a professional — do not attempt to repair electrical equipment yourself.
Modern panels degrade at 0.25-0.5% per year, with most manufacturers warranting at least 80% output at 25 years. After 10 years, expect about 96% of original capacity. After 20 years, about 92%. If you're seeing more than 1% per year decline, something other than normal degradation is causing the problem — it could be soiling, shading, or equipment issues.
This is called being a "solar orphan" and it's increasingly common as installers consolidate or close. Any licensed electrician with solar experience can service your system, but they'll need your original design documents and equipment specs. NuWatt Energy operates a Solar Orphan Rescue program — we adopt systems from defunct installers, help reconnect you to manufacturer monitoring portals, handle warranty claims, and provide maintenance and repair support.
A comprehensive diagnostic including thermal imaging, IV curve tracing, string-level testing, and inverter inspection typically costs $200-$500 depending on system size and location. This is worthwhile if you've already tried basic troubleshooting (checking monitoring, cleaning panels) without improvement. Many issues found during diagnostics are covered under existing panel or inverter warranties.
Yes — with string inverters, shade on even one panel can reduce the entire string output by 30-80% because panels are wired in series. Microinverters and DC optimizers isolate each panel, so shading only affects the shaded panel. If trees have grown since installation, a professional shading analysis can quantify the impact and recommend trimming or equipment upgrades.
Consider replacement if: your panels are 15+ years old and producing below warranty levels, modern replacement panels would produce 30-40% more per panel, your inverter has failed and you're facing a full replacement anyway, or physical damage is widespread across multiple panels. Often, replacing just the inverter (or upgrading to microinverters) recovers most lost production at lower cost than full panel replacement.
Yes. Solar panels are tested at 25C (77F), and most lose 0.3-0.4% output per degree Celsius above that. On a 40C (104F) day, panels can lose 4.5-6% efficiency. This is why Texas systems produce slightly less per peak sun hour in July/August than in April/May despite longer days. Good airflow under panels and lighter-colored roofing help mitigate heat losses.
NuWatt's solar service team diagnoses underperforming systems across New England, New Jersey, New York, Pennsylvania, and Texas. Whether your installer is still around or long gone — we can help.