Loading NuWatt Energy...
We use your location to provide localized solar offers and incentives.
We serve MA, NH, CT, RI, ME, VT, NJ, PA, and TX
Loading NuWatt Energy...
NuWatt designs, installs, and manages solar, battery, heat pump, and EV charger systems across 9 states. One company, one warranty, one point of contact.
Get a Free Quote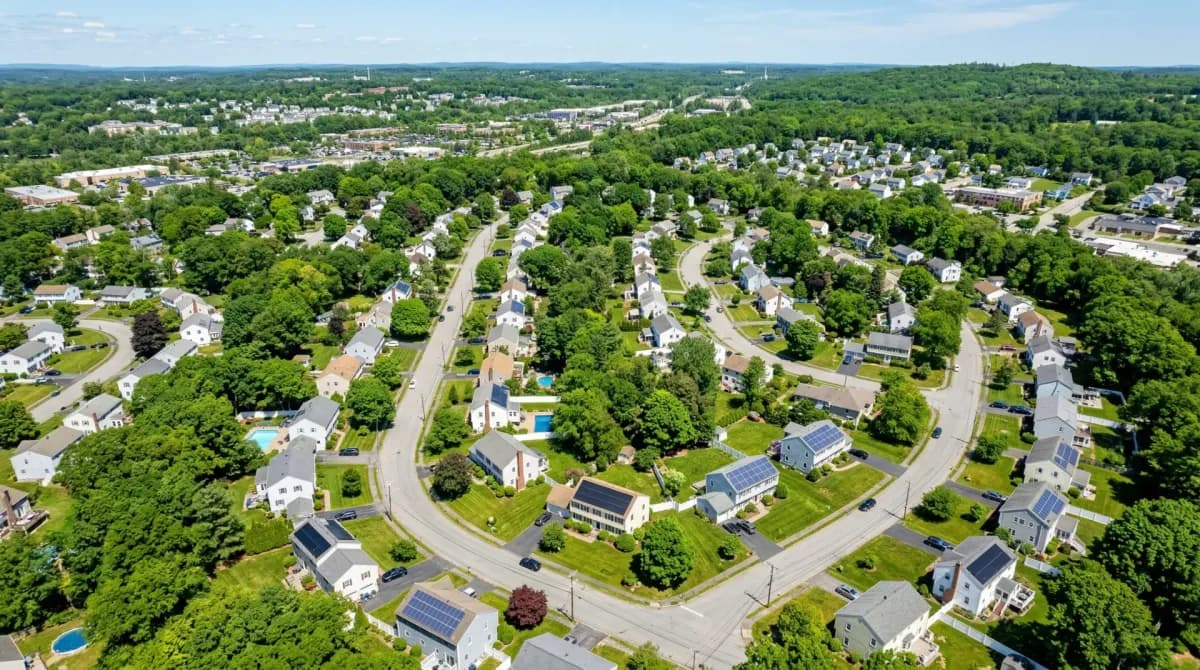
MetroWest's largest city with ~73,000 residents, diverse neighborhoods, and affordable housing that delivers strong solar ROI. Eversource territory at $0.36/kWh. SMART 3.0 + ConnectedSolutions make Framingham one of the best solar values in the region.
Eversource territory • SMART 3.0 • ConnectedSolutions eligible • MetroWest hub
2026 Reality: The 30% federal tax credit (Section 25D) expired for homeowners December 31, 2025. All costs in this guide reflect $0 federal credit. Full details
A 12 kW solar system in Framingham costs $36,000-$40,200 in 2026. In Eversource territory at $0.36/kWh, with SMART income of ~$432/yr and full retail net metering, the investment pays for itself in 6.4-7.2 years and generates ~$137,890 in savings over 25 years.
Cost Range
$3.00-$3.35/W
Fully installed
Avg System
12 kW
Framingham average
Payback
6.4-7.2 yrs
Cash purchase
25-Year Savings
~$138K
Estimated total value
Framingham is the largest city in MetroWest with ~73,000 residents. It became a city in 2018, transitioning from one of the largest towns in the US. Its diverse housing stock and more affordable price points make solar accessible to a wide range of homeowners.
Population
~73,000
Median Home Value
~$520,000
Primary Utility
Eversource
Electric Rate
$0.36/kWh
Typical System Size
10-15 kW
Solar Irradiance
4.2 kWh/m²/day
Costs for different system sizes in Framingham at $3.00-3.35/W. Framingham homes range from smaller condos (7-9 kW) to large colonials near Salem End Road (15-18 kW).
| System Size | Low Cost | High Cost | SMART 3.0 | Best For |
|---|---|---|---|---|
| 7 kW | $21,000 | $23,450 | ~$252/yr | Condo / smaller ranch |
| 9 kW | $27,000 | $30,150 | ~$324/yr | Mid-size cape or colonial |
| 12 kW | $36,000 | $40,200 | ~$432/yr | Typical Framingham single-family |
| 15 kW | $45,000 | $50,250 | ~$540/yr | Large home / EV + battery |
| 18 kW | $54,000 | $60,300 | ~$648/yr | High usage / multi-zone HVAC |
Prices include equipment, labor, permits, and grid interconnection. No federal tax credit included (expired). $1,000 MA state tax credit not deducted.
Framingham's neighborhoods vary widely -- from dense downtown areas to spacious western suburbs. Here is how solar conditions vary across the city.
Home Types
Split-levels, ranches, colonials
Avg System
11-14 kW
Western Framingham neighborhoods with spacious lots and good south-facing roof access. Post-war housing stock with ideal roof pitches. Strong solar adoption area.
Home Types
Victorians, colonials, newer infill
Avg System
10-12 kW
Historic town center area near Framingham State University. Mix of older homes with some newer construction. Mature tree canopy in spots, but generally good solar access.
Home Types
Multi-family, triple-deckers, apartments
Avg System
8-10 kW
Diverse, denser neighborhood near the Commuter Rail. Multi-family and triple-deckers can install rooftop solar with shared benefits. Community solar ideal for renters.
Home Types
Large colonials, newer construction
Avg System
12-16 kW
More affluent neighborhoods with larger lots and newer homes. Excellent roof conditions, minimal shading, and higher electricity consumption make for strong solar ROI.
Framingham's Building Department issues solar permits in about 10 business days, with a $75-$125 fee and a required separate electrical permit. The process is well-organized — a benefit of the professional city-manager structure adopted when Framingham became a city in 2018. Eversource interconnection runs roughly 22 business days.
Installer evaluates roof, shading, and orientation — and on larger South Framingham lots, whether a ground-mount array beats the roof.
Building permit ($75-$125) plus a separate electrical permit to the Framingham Building Department. Online submission; ~10 business days.
Typical installation 1-3 days, then electrical and building inspection by the City of Framingham.
Eversource approves the grid connection in ~22 business days. Net metering activates once approved.
Massachusetts offers one of the strongest solar incentive packages in the country, and each program applies to a Framingham home in Eversource territory exactly as it does statewide. The figures below are sized for Framingham's typical 12 kW system; the full program mechanics live in our SMART 3.0 and ConnectedSolutions guides.
$0.03/kWh on all production for 20 years — ~$432/yr on a 12 kW Framingham system.
~$432/yr
~$8,200 over 20 years
1:1 retail credit at $0.36/kWh — the biggest single driver of a 12 kW Framingham system's return.
~$5,170/yr
Annual electricity savings (12 kW)
Eversource battery demand response: $275/kW summer + $50/kW winter.
$3,250/yr
Typical 10 kW battery
15% of cost, capped at $1,000, on your MA return.
$1,000
One-time credit
6.25% MA sales tax waived on the system at purchase.
~$2,381
Savings on typical system
20 years of exemption on the added home value, at Framingham's 0.995% rate.
~$379/yr
20-year exemption (~$7,580 total)
Two things set Framingham apart from its MetroWest neighbors for solar, and both are genuinely local. The first is governance: Framingham was one of the largest towns in the United States until it became a city in 2018. The second is land: South Framingham, in particular, carries larger residential lots than the denser town centers around it — and lot size is what decides how big a system you can build.
Becoming a city in 2018 gave Framingham a professional city-manager structure and a well-organized Building Department. For a solar homeowner that shows up as a predictable, well-documented permit process — permits issued in about 10 business days, with a $75-$125 fee and a separate electrical permit filed alongside the building permit.
The larger lots common in South Framingham do two things. They give roofs more clearance from shading neighbors and trees, and — for homes where the roof is small, shaded, or wrong-facing — they leave open yard for a ground-mount array instead. That flexibility is why the cost table here runs all the way up to an 18 kW tier.
The combination matters for system sizing. A homeowner on a larger South Framingham lot has the physical room to go bigger — covering an EV, a heat pump, or a battery without running out of roof — and a ground-mount fallback when the roof itself is not the best surface. Pair that with Framingham's more affordable $3.00–3.35/W pricing and the city earns its reputation as one of the strongest solar values in MetroWest.
Section 25D (the 30% residential credit) expired December 31, 2025 — cash and loan buyers get $0 federal credit. The remaining indirect path for a Framingham homeowner is a PPA or lease, where the third-party owner claims the commercial Section 48/48E ITC and passes part of it through as a lower PPA rate.
Read: What happened to the solar tax creditThree ways to pay for solar in Framingham. With the city's more affordable $3.00–3.35/W pricing and the room on larger South Framingham lots to size up, cash and loan buyers here can build bigger for the same budget. A PPA stays $0 down because the third-party owner claims the commercial Section 48 ITC and prices your power below the Eversource retail rate.
Upfront
~$36,000-$40,200
Monthly
$0
25-yr Savings
~$138K
Ownership
You own it
Best long-term ROI. 6.4-7.2 year payback. Full SMART income + net metering yours.
Upfront
$0 down
Monthly
~$245-340/mo (5.5-8% APR)
25-yr Savings
~$80-100K
Ownership
You own it
10-25 year terms through local lenders and credit unions. SMART income + net metering offset payments.
Upfront
$0
Monthly
Fixed ~$0.14-0.18/kWh
25-yr Savings
~$35-50K
Ownership
Third party owns
Third-party owner claims Section 48 ITC. You buy power at a discount. Immediate savings.
How Framingham solar costs compare to neighboring MetroWest communities. All are in Eversource territory with access to the same state incentives.
| City/Town | Cost/W | Avg System | Utility | Notes |
|---|---|---|---|---|
| Framingham | $3.00-3.35 | 12 kW | Eversource | MetroWest hub, diverse housing, affordable entry |
| Natick | $3.05-3.40 | 12 kW | Eversource | Affluent neighbor, newer housing stock |
| Ashland | $3.00-3.35 | 11 kW | Eversource | Similar pricing, smaller community |
| Marlborough | $2.95-3.30 | 11 kW | Eversource | City to the west, slightly lower costs |
| Sudbury | $3.10-3.45 | 13 kW | Eversource | Larger homes, higher values |
Explore the complete library of Massachusetts solar guides, incentive programs, and local energy resources.
MA Solar Guide 2026
Complete guide to going solar in Massachusetts in 2026.
Solar Panel Cost in MA
Statewide cost breakdown: $2.80–$3.50/W by city and utility.
SMART Program Guide
$0.03/kWh for 20 years. How to enroll and maximize income.
Net Metering in MA
1:1 retail credit. Rules, caps, and how to lock in your rate.
Mass Save Heat Pump Rebates
Up to $8,500 back on heat pumps through Mass Save.
ConnectedSolutions Battery
Earn $275/kW summer demand response with Eversource.
Income-Eligible Programs
Free or deeply discounted upgrades for income-qualified homeowners.
Solar Financing Options
Cash, loan, and PPA compared for MA homeowners.
Solar panels in Framingham cost $3.00-3.35 per watt installed in 2026. A typical 12 kW system costs $36,000-$40,200 before MA state incentives. The federal Section 25D residential tax credit expired December 31, 2025 -- homeowners receive $0 in federal credit. Massachusetts state incentives (SMART 3.0, net metering, state tax credit, and tax exemptions) still make solar highly profitable in Framingham.
Framingham benefits from slightly lower installation costs ($3.00-3.35/W vs. $3.10-3.45/W) due to its more accessible housing stock. Many Framingham homes have straightforward roof access, larger lots, and fewer historic restrictions. Combined with lower property values (lower overhead and insurance costs for installers), this creates a competitive market that keeps pricing down.
Often, yes -- and that is a genuinely local factor. South Framingham in particular carries larger residential lots than the denser town centers around it, and lot size is what decides how big a system you can build. Larger lots give roofs more clearance from shading trees and neighbors, and where the roof is small, shaded, or wrong-facing, they leave open yard for a ground-mount array instead. That extra room is why Framingham's cost table runs all the way up to an 18 kW tier -- enough headroom to cover an EV, a heat pump, and a battery without running out of space. The earnings on that production come through the standard programs (SMART 3.0 at $0.03/kWh for 20 years, 1:1 net metering), which apply the same way as in any Eversource town.
Yes. Framingham transitioned from a town to a city in January 2018. This has generally been positive for solar -- the city government has been proactive about sustainability initiatives, and the professional city manager structure has streamlined the permitting process. The Building Department handles solar permits efficiently, typically in 2-3 weeks.
Yes. Framingham has one of the best solar value propositions in MetroWest. The slightly lower installation costs ($3.00-3.35/W), combined with the high Eversource rate ($0.36/kWh), SMART 3.0 income, and full 1:1 net metering, create a 6.4-7.2 year payback even without the federal credit. Over 25 years, a typical system saves approximately $137,890.
We will assess your specific roof, neighborhood conditions, and Eversource rate to show you exactly what solar costs and saves for your Framingham home -- including SMART 3.0 and ConnectedSolutions.
Complete guide to solar in Massachusetts.
Read moreStatewide solar costs and city-by-city breakdown.
Read more$0.03/kWh for 20 years. How to enroll and earn.
Read moreEarn $225-$1,500/yr per battery.
Read moreMetroWest neighbor. $3.05-3.40/W.
Read moreRoute 128 corridor. $3.05-3.40/W.
Read more25D expired. What options remain.
Read moreCompare utility rates, net metering, and solar economics.
Read moreTrack rate changes across MA utilities since 2020.
Read moreLive installation data, capacity trends, and market stats.
Read moreCurrent wait times, bottlenecks, and how to get connected faster.
Read morePricing: EnergySage Solar Marketplace (January 2026), NuWatt Energy MetroWest installations.
Utility rates: Eversource residential rate schedule RS, effective February 2026.
SMART 3.0: MassDOER / MassCEC, SMART program guidelines PY2026.
ConnectedSolutions: Eversource demand response program rates, 2026 season.
Tax exemptions: MA Department of Revenue, Framingham Assessor data.