Loading NuWatt Energy...
We use your location to provide localized solar offers and incentives.
We serve MA, NH, CT, RI, ME, VT, NJ, PA, and TX
Loading NuWatt Energy...
NuWatt designs, installs, and manages solar, battery, heat pump, and EV charger systems across 9 states. One company, one warranty, one point of contact.
Get a Free Quote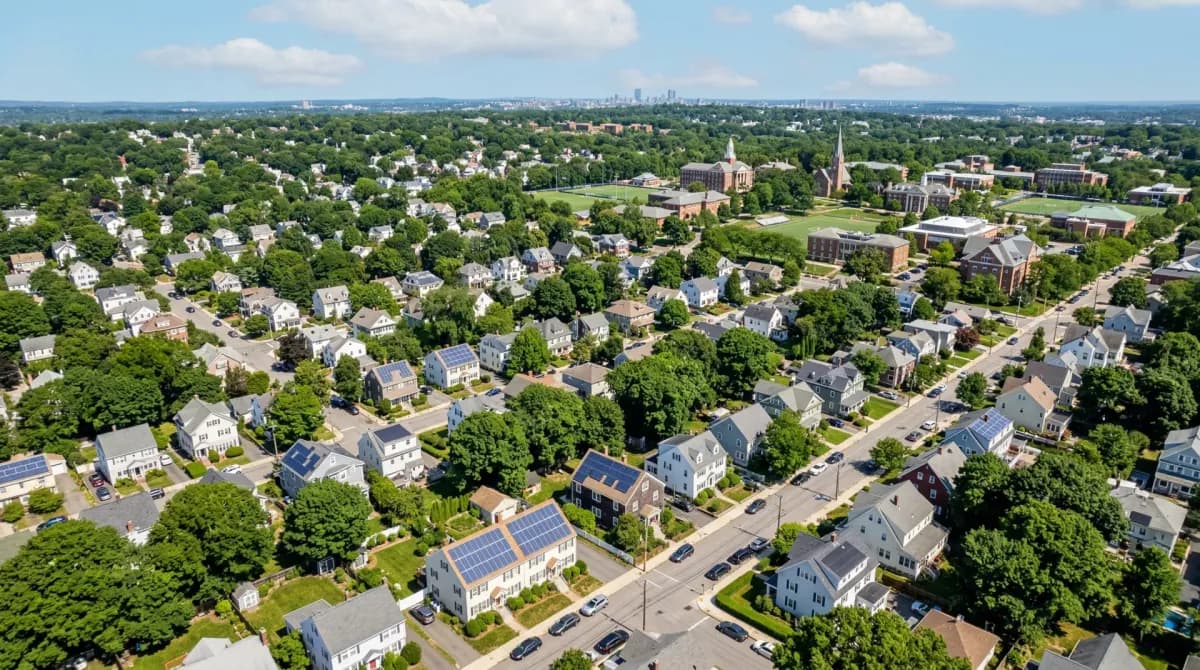
Home to Tufts University with 59,000 residents and a healthy mix of single-family and multi-family housing. Eversource territory at $0.36/kWh. Among the most affordable solar in metro Boston.
Eversource territory • SMART 3.0 • ConnectedSolutions eligible • Tufts area
2026 Reality: The 30% federal tax credit (Section 25D) expired for homeowners December 31, 2025. All costs in this guide reflect $0 federal credit. Full details
A 10.5 kW solar system in Medford costs $32,025-$35,700 in 2026. In Eversource territory at $0.36/kWh, with SMART income of ~$378/yr and full retail net metering, the investment pays for itself in 6.5-7.3 years and generates ~$120,635 in savings over 25 years.
Cost Range
$3.05-$3.40/W
Fully installed
Avg System
10.5 kW
Medford average
Payback
6.5-7.3 yrs
Cash purchase
25-Year Savings
~$121K
Estimated total value
Medford is a diverse city of ~59,000 residents, home to Tufts University. The housing stock ranges from single-family colonials and ranches in West Medford and North Medford to denser triple-deckers in South Medford near the Somerville border.
Population
~59,000
Median Home Value
~$700,000
Primary Utility
Eversource
Electric Rate
$0.36/kWh
Typical System Size
9-13 kW
Solar Irradiance
4.2 kWh/m²/day
Costs for different system sizes in Medford at $3.05-3.40/W. Medford offers some of the most affordable solar pricing in the metro Boston area.
| System Size | Low Cost | High Cost | SMART 3.0 | Best For |
|---|---|---|---|---|
| 7 kW | $21,350 | $23,800 | ~$252/yr | Condo / small ranch |
| 8.5 kW | $25,925 | $28,900 | ~$306/yr | Mid-size colonial / cape |
| 10.5 kW | $32,025 | $35,700 | ~$378/yr | Typical Medford single-family |
| 13 kW | $39,650 | $44,200 | ~$468/yr | Large home / EV + battery |
Prices include equipment, labor, permits, and grid interconnection. No federal tax credit included (expired). $1,000 MA state tax credit not deducted.
Medford's neighborhoods offer varying solar conditions based on housing density and terrain. Here is how the main areas compare.
Home Types
Single-family colonials, Capes, ranches
Avg System
10-13 kW
Predominantly single-family residential area with good lot sizes. Near the Tufts campus border. Mature trees in some areas but generally excellent south-facing roof access. Strong solar adoption.
Home Types
Single-family, some multi-family
Avg System
10-12 kW
Elevated terrain near Tufts provides good sun exposure. Mix of single-family and smaller multi-family buildings. Hillside orientation means many south-facing slopes ideal for solar panels.
Home Types
Triple-deckers, multi-family, Victorians
Avg System
7-9 kW
Denser area bordering Somerville with more multi-family housing. Triple-deckers with flat roofs work well for solar. Some building-to-building shading in tighter blocks.
Home Types
Single-family, ranches, split-levels
Avg System
9-12 kW
Residential area with post-war housing stock. Many 1950s-1970s ranches and split-levels with simple roof lines ideal for solar installation. Good lot spacing reduces shading issues.
What sets Medford apart from a typical suburban solar market is its housing mix. Alongside the single-family colonials and ranches of West Medford and North Medford, Medford has a deep stock of two- and three-family homes and classic New England triple-deckers, concentrated in South Medford near the Somerville line. The economics and the engineering both look different on a triple-decker than on a single-family roof, and it is worth understanding why before you get a quote.
Many Medford triple-deckers carry a low-slope or near-flat roof rather than a steep gable. That favors a ballasted or low-tilt racking layout, opens up east-west panel orientations, and usually means no roof penetrations through a steep pitch. The trade-off is that a flat roof fits fewer watts per square foot than an optimally pitched south slope, so per-unit arrays tend to be smaller (often 7–9 kW) than the 10–13 kW you would size on a West Medford colonial.
On a multi-unit building the roof is shared. If the building is owner-occupied with rental units, one owner can move quickly. If it is a condo, the condo association typically has to vote to approve a rooftop installation and decide how production and credits are allocated. That governance step — not the city — is usually the longest part of the timeline on a Medford multi-family project.
A three-family home often has three separate Eversource meters. Solar can be wired to a single unit’s meter, or the building owner can use Massachusetts virtual net metering to split one rooftop array’s credits across the units. Virtual net metering is what makes a single shared array practical on a building where each unit pays its own bill.
If your building can’t take rooftop solar— shading from neighboring triple-deckers on a tight South Medford block, a roof that needs replacement first, or a condo board that isn’t ready — community solar is the fallback. You subscribe to an off-site Massachusetts solar farm and receive credits on your Eversource bill with no rooftop work and no upfront cost. It is a common fit for renters and condo owners in Medford’s denser neighborhoods.
Medford is one of the easier Boston-area cities to permit solar in. The Building Department turns residential solar applications around in about 8 business days — among the fastest in the inner-Boston suburbs — and there is no historic-district overlay and no separate electrical permit to file. Permit fees run roughly $50–$100, and applications are accepted online. There is no shorter way to say it: Medford gets out of the way.
Eversource interconnection adds about 22 business days on top of the permit. For a typical single-family Medford install that puts the contract-to-PTO window around 5–10 weeks. Multi-family and triple-decker projects can run a little longer where a condo association or co-owner sign-off is needed before the application goes in (more on that below).
Permit Time
~8 business days
Among the fastest in metro Boston
Permit Fee
$50–$100
Online applications accepted
Historic Overlay
None
No design-review delay
Interconnection
~22 business days
Eversource net metering
Installer evaluates roof condition, shade, orientation, and structural capacity. On a triple-decker, this also confirms which roof plane and electrical service the array ties into.
Online application to Medford Building Department with electrical and structural plans. No separate electrical permit and no historic-district review — a single residential solar permit clears it.
Typical installation 1-3 days. Building and electrical inspection by the City of Medford.
Eversource approves grid connection in about 22 business days. Net metering activated once approved.
Medford homeowners stack the same statewide incentives every Eversource-territory MA homeowner can. Below are the Medford-specific dollar figures for a typical 10.5 kW system; for the full program mechanics see our SMART 3.0 guide, net metering guide, and ConnectedSolutions guide.
$0.03/kWh on every kWh produced for 20 years — ~$378/yr for a 10.5 kW Medford system.
~$378/yr
~$7,180 over 20 years
Full retail 1:1 credit at $0.36/kWh. On a 10.5 kW Medford roof that is the single largest line of savings.
~$4,523/yr
Annual electricity savings (10.5 kW)
Battery demand-response: $275/kW summer + $50/kW winter. Pairs well with a single-family Medford home that wants backup.
$3,250/yr
Typical 10 kW battery
15% of cost, capped at $1,000 on your MA return.
$1,000
One-time credit
No 6.25% MA sales tax on the system.
~$2,116
Savings on typical system
Added home value exempt for 20 years at Medford's 1.098% rate.
~$372/yr
20-year exemption (~$7,440 total)
Section 25D (the 30% residential solar tax credit) expired December 31, 2025 under the OBBBA, so a Medford homeowner buying cash or with a loan receives $0 in federal credit. The commercial Section 48/48E ITC is still active for third-party owners (the route a PPA uses), and it is not a hard cliff: projects that began construction on or before July 4, 2026 locked in the favorable timing, while projects that start after that date still qualify as long as they are placed in service by December 31, 2027.
Read: What happened to the solar tax creditThree ways to pay for solar in Medford. Cash wins on lifetime ROI; loans spread the ~$32,025-$35,700 cost of a typical 10.5 kW system with $0 down; a PPA needs no money down because the third-party owner — not you — claims the commercial Section 48 ITC. For a multi-family building, cash or loan ownership by the building owner is usually cleaner than a PPA when production is being split across units.
Upfront
~$32,025-$35,700
Monthly
$0
25-yr Savings
~$121K
Ownership
You own it
Best long-term ROI. 6.5-7.3 year payback. Full SMART + net metering income.
Upfront
$0 down
Monthly
~$220-310/mo (5.5-8% APR)
25-yr Savings
~$70-90K
Ownership
You own it
10-25 year terms through local lenders and credit unions.
Upfront
$0
Monthly
Fixed ~$0.14-0.18/kWh
25-yr Savings
~$30-45K
Ownership
Third party owns
Third-party owner claims Section 48 ITC. You buy power at a discount.
| City/Town | Cost/W | Avg System | Notes |
|---|---|---|---|
| Medford | $3.05-3.40 | 10.5 kW | Tufts area, mix of single/multi, affordable solar |
| Somerville | $3.10-3.45 | 8.5 kW | Densest in NE, triple-deckers, EJ community |
| Arlington | $3.10-3.45 | 11 kW | Sustainability culture, CCA program |
| Malden | $3.05-3.40 | 10 kW | Similar housing stock, slightly lower values |
| Winchester | $3.10-3.45 | 12 kW | Affluent suburb, larger single-family homes |
Solar panels in Medford cost $3.05-3.40 per watt installed in 2026. A typical 10.5 kW system costs $32,025-$35,700 before MA state incentives. The federal Section 25D residential tax credit expired December 31, 2025 -- homeowners receive $0 in federal credit. Massachusetts incentives (SMART 3.0, net metering, $1,000 state credit, tax exemptions) still deliver strong ROI.
Medford benefits from lower permitting complexity compared to dense urban areas and more straightforward roof access on its single-family housing stock. Fewer historic district requirements and simpler installation logistics on colonial and ranch-style homes help keep costs at the lower end of the metro Boston range.
Yes. Medford has a 6.5-7.3 year payback even without the federal credit, driven by high Eversource rates ($0.36/kWh), SMART 3.0 income (~$378/yr for 10.5 kW), full retail net metering, and MA state incentives. Over 25 years a typical system saves approximately $120,635.
Medford has a significant number of multi-family and triple-decker buildings, especially in South Medford near the Somerville border. Building owners can install solar and use virtual net metering to allocate credits to tenants. Condo associations can vote for shared rooftop solar. Community solar is available for buildings where rooftop installation is not practical.
Usually smaller per array. Many Medford triple-deckers have a low-slope or near-flat roof, which is great for a clean ballasted layout but fits fewer watts per square foot than the pitched south slope of a West Medford colonial. A single triple-decker roof commonly supports a 7-9 kW array versus 10-13 kW on a larger single-family home. If three units share one rooftop array, virtual net metering can split the credits across the units so each tenant or owner benefits.
We will assess your specific roof, neighborhood conditions, and Eversource rate to show you exactly what solar costs and saves for your Medford home.
Complete hub for MA solar, heat pumps, and utility resources.
Read moreStatewide solar costs and city-by-city breakdown.
Read more$0.03/kWh for 20 years. How to enroll and earn.
Read moreEarn $275/kW summer. Demand response revenue.
Read moreAdjacent city. $3.10-3.45/W, densest in NE.
Read moreNearby suburb. $3.10-3.45/W, CCA program.
Read more25D expired. What options remain for homeowners.
Read moreCompare utility rates, net metering, and solar economics.
Read moreTrack rate changes across MA utilities since 2020.
Read moreLive installation data, capacity trends, and market stats.
Read moreCurrent wait times, bottlenecks, and how to get connected faster.
Read morePricing: EnergySage Solar Marketplace (January 2026), NuWatt Energy Greater Boston installations.
Utility rates: Eversource residential rate schedule RS, effective February 2026.
SMART 3.0: MassDOER / MassCEC, SMART program guidelines PY2026.
ConnectedSolutions: Eversource demand response program rates, 2026 season.
Tax exemptions: MA Department of Revenue, Medford Assessor data.