Loading NuWatt Energy...
We use your location to provide localized solar offers and incentives.
We serve MA, NH, CT, RI, ME, VT, NJ, PA, and TX
Loading NuWatt Energy...
NuWatt designs, installs, and manages solar, battery, heat pump, and EV charger systems across 9 states. One company, one warranty, one point of contact.
Get a Free Quote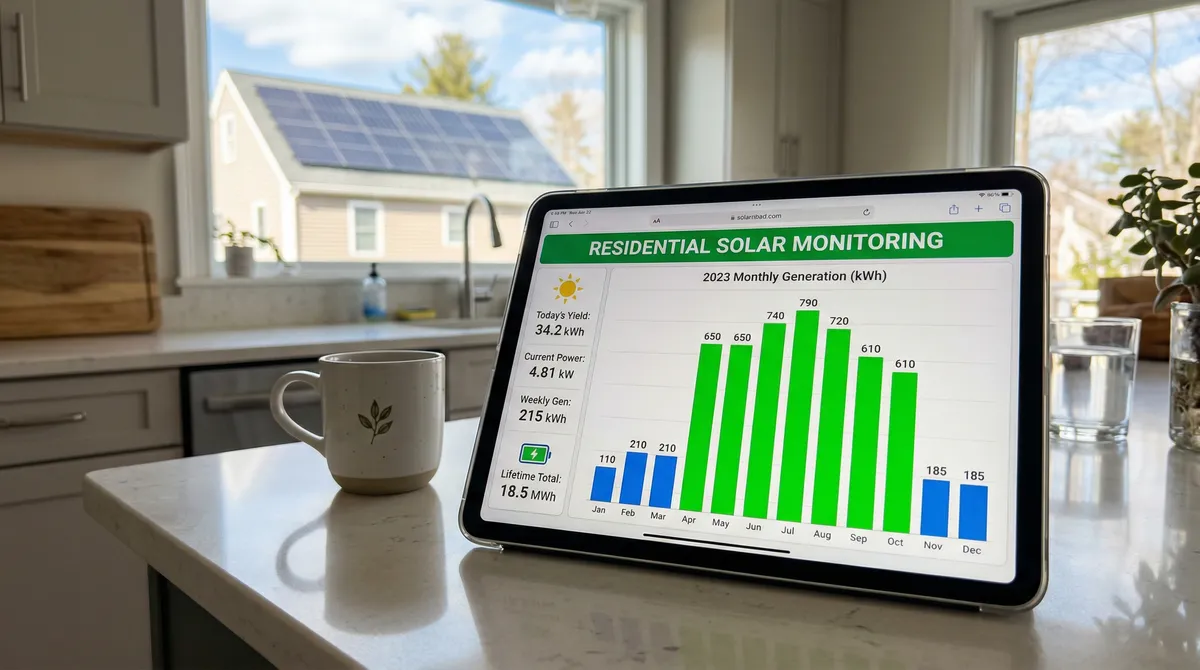
A 10 kW system in Massachusetts should produce 12,000-13,800 kWh per year. If your system is underperforming, this guide walks you through diagnosis — from checking your monitoring app to knowing when to call your installer.
Your monitoring platform depends on your inverter brand. Each app shows production data differently, but the core function is the same: is your system producing what it should?
Best for: Most Massachusetts installations. Default choice for residential solar.
Best for: Larger systems or commercial installations. Less common in MA residential.
Best for: Budget-friendly installations. Growing market share in MA.
Best for: Tesla solar or Powerwall battery owners. Integrated ecosystem.
| Feature | Enphase | SolarEdge | Hoymiles | Tesla |
|---|---|---|---|---|
| Panel-level data | Native (each microinverter) | Via power optimizer | Native (each microinverter) | Not available |
| Data refresh rate | 5-minute intervals | 15-minute intervals | 5-minute intervals | 5-minute intervals |
| Mobile app | Enlighten (iOS/Android) | MySolarEdge (iOS/Android) | S-Miles (iOS/Android) | Tesla App (iOS/Android) |
| Alert types | Push + Email | Email only | Push + Email | Push only |
| Consumption monitoring | Optional CT clamps | Optional CT clamps | Optional CT clamps | Built-in (Powerwall req.) |
| Battery integration | IQ Battery | StorEdge | Third-party | Powerwall native |
| Export data (CSV) | Yes | Yes | Yes | Limited |
| Historical data retention | Lifetime (cloud) | Lifetime (cloud) | 5 years free | Lifetime (with Tesla) |
| ConnectedSolutions compatible | IQ Battery | Via StorEdge | N/A | Powerwall + Virtual PP |
| SMART reporting | Separate meter | Separate meter | Separate meter | Separate meter |
You do not need to check your app every day. Set up alerts for critical issues and follow this schedule for routine monitoring.
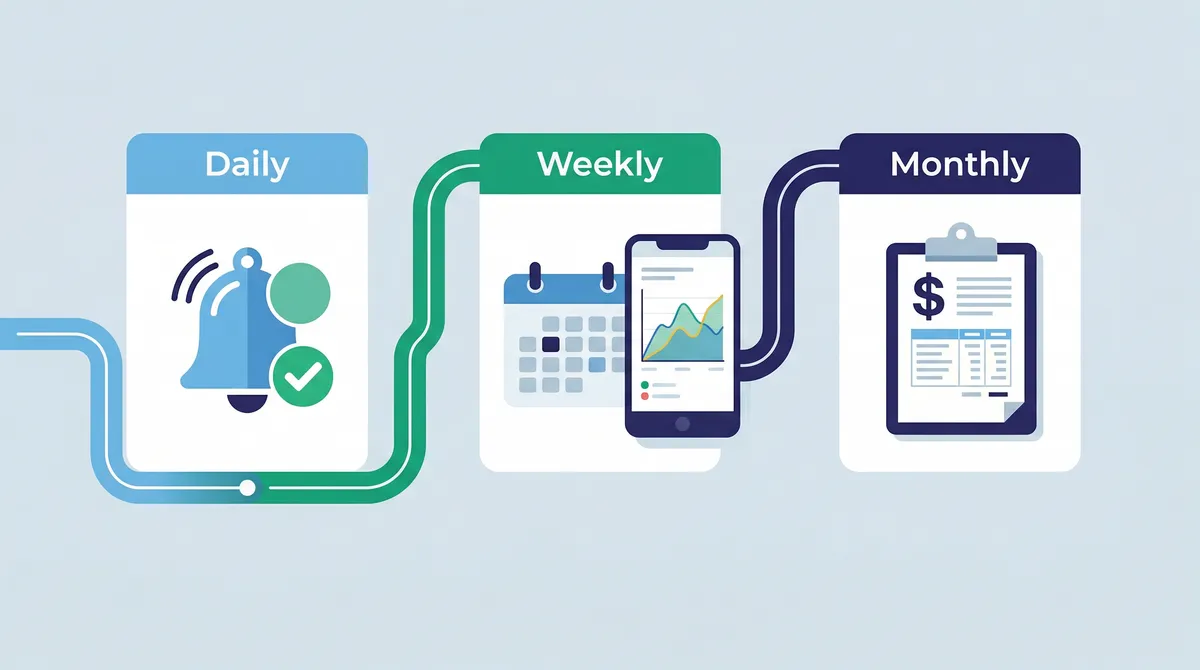
Tip: Set alerts to trigger only for production > 25% below expected on clear days. This avoids nuisance alerts on cloudy days.
Tip: Best time to check: Sunday evening. Review the full week's production in one glance.
Tip: Keep a simple spreadsheet: Month, Expected kWh, Actual kWh, Variance %. Spot trends before they become problems.
These benchmarks are for a south-facing, 30-degree tilt system with minimal shading in eastern Massachusetts. Your actual production may vary by +/-15% based on orientation, tilt, and local conditions.
| Month | kWh/kW | 10 kW System | SMART Earnings | Peak Sun Hours/Day | Notes |
|---|---|---|---|---|---|
| January | 40-55 | 400-550 kWh | $12-$17 | 3.0 | Lowest production month. Snow cover may reduce output 1-3 days. |
| February | 50-65 | 500-650 kWh | $15-$20 | 3.8 | Production climbing. Ice dam risk on panels. |
| March | 75-95 | 750-950 kWh | $23-$29 | 4.5 | Equinox. Good time for annual panel inspection. |
| April | 100-120 | 1,000-1,200 kWh | $30-$36 | 5.2 | Pollen season begins. Monitor for soiling buildup. |
| May | 120-140 | 1,200-1,400 kWh | $36-$42 | 5.8 | Near-peak output. Leaves fully out — check new shading. |
| June | 130-155 | 1,300-1,550 kWh | $39-$47 | 6.2 | Peak month. Longest days. ConnectedSolutions events begin. |
| July | 125-150 | 1,250-1,500 kWh | $38-$45 | 6.0 | Heat can reduce efficiency 5-10%. Still peak season. |
| August | 110-135 | 1,100-1,350 kWh | $33-$41 | 5.5 | Days shortening. ConnectedSolutions events continue. |
| September | 90-110 | 900-1,100 kWh | $27-$33 | 4.8 | Equinox. Leaf fall begins — watch for debris on panels. |
| October | 65-80 | 650-800 kWh | $20-$24 | 3.9 | Deciduous shade clearing. Production declining. |
| November | 40-55 | 400-550 kWh | $12-$17 | 2.9 | Short days, low sun angle. Check gutters near panels. |
| December | 35-50 | 350-500 kWh | $11-$15 | 2.6 | Shortest day (Dec 21). Snow reflection can briefly boost output. |
| Annual Total | 980-1,210 | 9,800-12,100 kWh | $294-$363 | 4.4 avg | Typical MA residential system |
* SMART earnings at $0.03/kWh flat rate. Actual production varies with roof orientation, shading, panel degradation (0.3-0.5%/year typical), and weather. Western MA may see 5-10% lower production due to higher cloud cover.
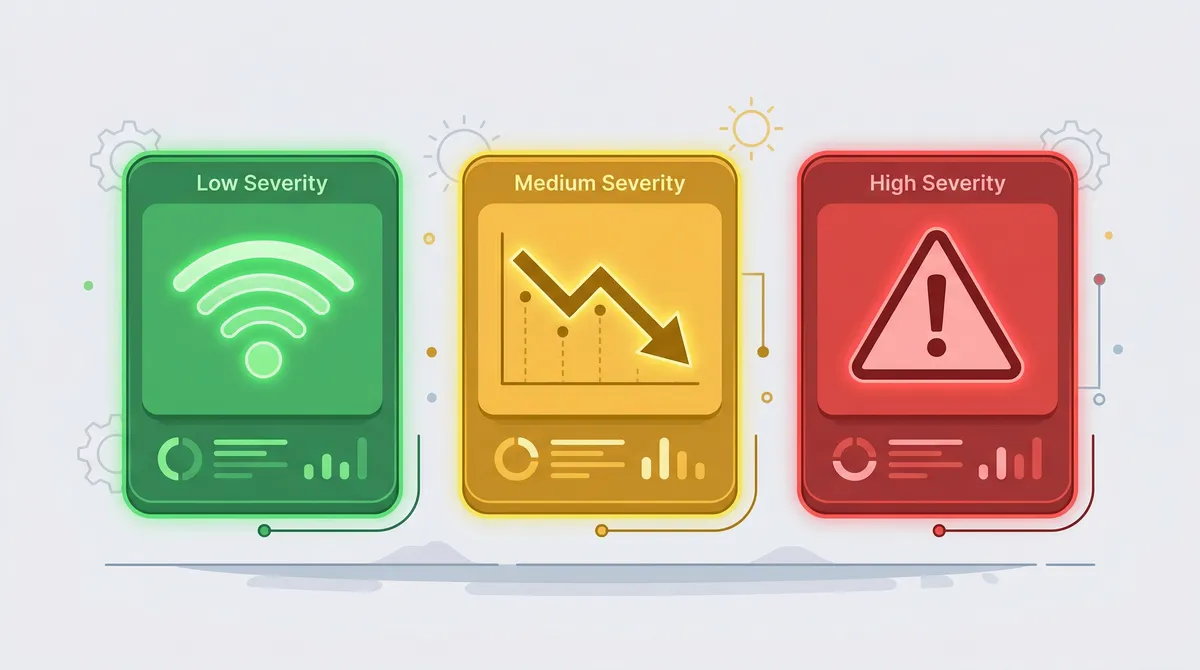
Monitoring apps send alerts when something seems off. Not all alerts require professional help. Here is how to read them across all four platforms.
Enphase
Envoy Offline
SolarEdge
Gateway Disconnected
Hoymiles
DTU Offline
Cause
Wi-Fi outage, router reboot, gateway power loss, or ISP issue
Action: Check router and restart gateway. System is likely still producing.
Enphase
System Underperforming
SolarEdge
Energy Below Expected
Hoymiles
Low Yield Warning
Cause
Cloudy weather, shading, soiling, panel degradation, or equipment failure
Action: Compare against monthly benchmarks. If sunny day and still low, check panels physically.
Enphase
Microinverter Not Reporting
SolarEdge
Optimizer Communication Error
Hoymiles
Module Offline
Cause
Failed microinverter/optimizer, wiring issue, panel defect, or critter damage
Action: Identify which panel in the app. Check for visible damage. Contact installer.
Enphase
N/A (distributed)
SolarEdge
Inverter Error [Code]
Hoymiles
Inverter Alarm
Cause
Grid voltage issue, overtemperature, arc fault, or internal failure
Action: Note the error code. Wait 5 min for auto-restart. If persistent, call installer.
Enphase
Grid Profile Error
SolarEdge
AC Voltage Out of Range
Hoymiles
Grid Abnormal
Cause
Utility voltage fluctuation, power outage, or local transformer issue
Action: Usually self-resolves within minutes. If repeated, contact your utility.
Enphase
Rapid Shutdown Event
SolarEdge
Safety Switch Activated
Hoymiles
Emergency Stop
Cause
Safety system activated by a fault, maintenance switch, or first responder
Action: Do NOT reset yourself. Contact your installer for inspection.
Follow these steps in order when your solar system is underperforming or showing errors. Each step helps narrow down the cause before escalating to your installer.
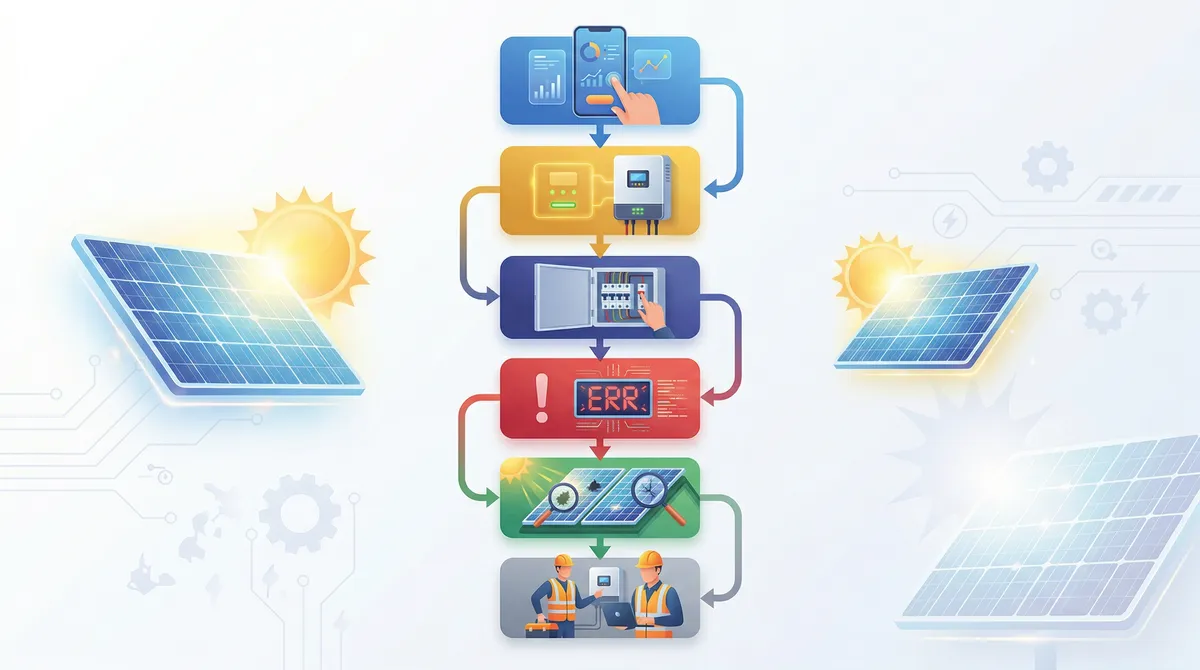
Open Enphase Enlighten, SolarEdge, Hoymiles S-Miles, or Tesla app. Look at system status and production data.
Check:
System is likely working normally. Compare against monthly benchmarks below.
Proceed to Step 2.
Go to your inverter (usually in basement, garage, or next to main panel). Look for status lights and error codes.
Check:
Inverter is running. If monitoring is offline, the issue is Wi-Fi/gateway. Proceed to Step 3.
Inverter error — write down the error code and proceed to Step 4.
Inspect your electrical panel for tripped breakers. Check if the grid is up (are lights working in your house?).
Check:
Breakers fine, grid up — the issue may be panel-level (shading, soiling, equipment). Proceed to Step 5.
Reset the tripped breaker. If it trips again, do NOT reset again — call your installer.
Common inverter error codes and what they mean. Do NOT attempt to open or repair the inverter yourself.
Check:
If it is a grid fault, wait 5 minutes for auto-restart. If it persists, call your installer.
For arc fault, isolation fault, or any unfamiliar code, call your installer. Do not reset.
If the inverter is fine but production is low, the issue is at the panel level.
Check:
Clean debris with a garden hose (never pressure wash). For shade, contact an arborist. For equipment failure, call your installer.
If all panels are uniformly low on a sunny day, the issue may be system-wide degradation or a meter problem. Call your installer for a production audit.
When you call, have this information ready for a faster diagnosis.
Check:
Your installer will schedule a site visit or remote diagnostic. Most issues under warranty are resolved at no cost.
Five common causes for underperformance in Massachusetts, ranked by likelihood. Each has a different timeframe, impact, and fix.
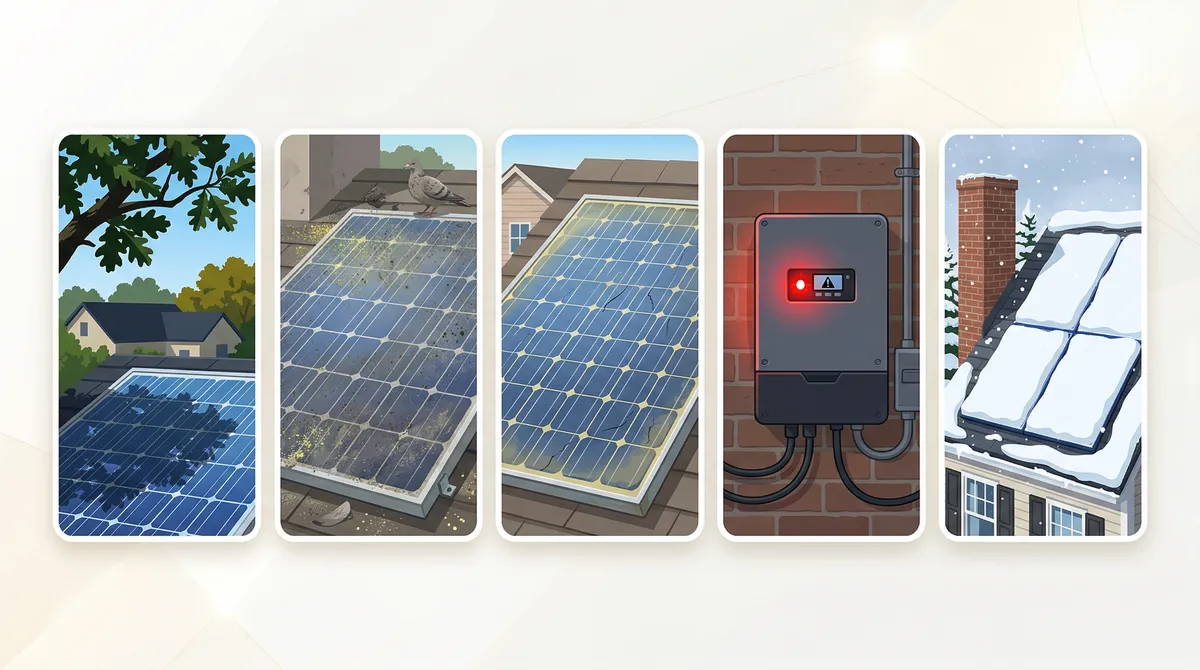
Trees grow 1-3 feet per year. A branch that cleared your panels at installation may shade them by year 3. Deciduous trees create seasonal shading patterns — compare summer vs winter production for affected panels.
Solution
Hire an arborist to trim branches. Cost: $200-$800 depending on access. Some installers offer shade analysis updates.
MA-Specific Note
Massachusetts towns often require permits for tree removal, especially in historic districts. Check with your town's tree warden.
Pollen season (April-June) in Massachusetts can coat panels with a yellow film. Bird droppings, lichen, and fallen leaves also reduce production. Rain typically clears light soiling.
Solution
Garden hose rinse from ground level. Never use a pressure washer, abrasive cleaner, or climb on the roof. Cost: $0 DIY or $150-$300 professional.
MA-Specific Note
MA gets 47 inches of rain annually — enough to keep panels reasonably clean. Professional cleaning is rarely needed more than once per year.
All solar panels lose efficiency over time. Modern panels are warranted to produce at least 80-87% of rated output at year 25. This is a slow, predictable decline — not a sudden drop.
Solution
Normal and expected. Compare year-over-year production. If degradation exceeds 1%/year, file a warranty claim with your panel manufacturer.
MA-Specific Note
Temperature cycling (-10F to 100F) in MA is within spec for all Tier 1 panels. Degradation rates in MA match national averages.
Microinverters, optimizers, and string inverters can fail. Enphase microinverters have 25-year warranties. SolarEdge inverters have 12-year warranties (25 years for optimizers). Failures are most common in years 1-2 (infant mortality) and years 10-15.
Solution
Contact your installer for warranty service. Most equipment failures are covered at no cost for 12-25 years.
MA-Specific Note
Massachusetts requires installers to register with the state. Licensed installer lookup: mass.gov/electrician-lookup
Snow slides off panels faster than off a regular roof due to the glass surface and dark color (heat absorption). Light dustings clear within hours. Heavy snow (6+ inches) may take 1-3 days.
Solution
Do NOT climb on your roof to clear snow. Panels are designed to handle it. A roof rake with a soft edge can be used from the ground for accessible panels. Production loss from snow is typically 2-5% of annual output in MA.
MA-Specific Note
Boston averages 48 inches of snow per year. Average annual production loss from snow: 3-4% — already factored into your proposal estimate.
Your monitoring app and your original proposal both contain production estimates. Here is how to compare them and what the numbers actually mean.
Total Production (kWh)
Electricity your panels generated. This is what SMART pays for.
Consumption (kWh)
Electricity your home used (requires CT clamps or utility integration).
Grid Export (kWh)
Excess electricity sent to the grid. You get net metering credits for this.
Grid Import (kWh)
Electricity you drew from the grid. This is what you pay your utility for.
Self-Consumption %
Production used directly in your home (not exported). Higher is better for savings.
Specific Yield (kWh/kWp)
Production per kW of panels. MA benchmark: 1,100-1,380 kWh/kWp/year.
Your installation proposal included an annual production estimate (e.g., "This system is expected to produce 12,500 kWh per year"). This estimate was modeled using your specific roof orientation, tilt, and shading analysis.
Within 10%
Normal. Proposals are estimates, not guarantees.
10-15% Below
Investigate. Could be a shading change or soiling.
15%+ Below
Contact your installer. Equipment issue or design error likely.
Massachusetts provides 1:1 net metering credits for systems up to 25 kW AC. Your monitoring app and your utility bill should tell the same story.
Export monthly kWh production from your monitoring app. Most apps let you download CSV or view monthly totals.
Find the "Net Metering" or "Generation Credits" section. Eversource and National Grid format this differently.
Your monitoring shows total production. Your bill shows grid import and export. Production = Consumption + Export - Import.
Massachusetts net metering credits at 1:1 retail rate for systems ≤25 kW AC. Verify the credit rate matches your supply + delivery rate.
A 5-10% variance is normal (inverter losses, meter calibration). If > 10%, request a billing review from your utility.
Eversource
National Grid
Perform this review every spring (March-April) before the high-production season. This ensures maximum production — and maximum SMART payments — through the year.
The SMART program pays $0.03/kWh for all solar production over 20 years. Here is what you need to know about reporting and verifying payments.
Rate
$0.03/kWh (flat, fixed at enrollment)
Term
20 years from PTO date
Metering
Separate production meter (utility-installed)
Payment frequency
Monthly or quarterly (varies by utility)
Data source
Production meter — NOT your monitoring app
Low-income adder
$0.06/kWh total (stacks with base rate)
Pull your annual monitoring data (total kWh)
Export from your monitoring app. Use the "lifetime" or "annual" view for the most accurate total.
Compare to SMART payment statements
Your SMART payments should equal total kWh x $0.03. A 10 kW system earning $300-$400/year is typical.
Flag any discrepancy > 5%
Your monitoring app may read slightly different from the production meter (different sensor accuracy). A 5% gap is normal. Larger gaps need investigation.
Request a meter reconciliation if needed
Contact your utility (Eversource or National Grid) to request a production meter test. Production meters rarely fail, but it does happen.
Compare your monitoring app's actual kWh production against the monthly benchmarks for Massachusetts: a 10 kW system should produce 1,100-1,400 kWh/month in summer (June-August) and 350-500 kWh/month in winter (December-January). Also compare against your original proposal estimate — if actual production is consistently 15%+ below the proposal, investigate further.
A communication loss alert means your monitoring gateway (Enphase Envoy or SolarEdge gateway) has lost its internet connection. Your solar panels are likely still producing electricity — they just cannot send data to the cloud. Check your home Wi-Fi router first, then restart the monitoring gateway. If the issue persists after 48 hours, contact your installer.
The most common causes for a single panel underperforming are: partial shading from a tree branch or chimney, bird droppings or debris on the panel, a failed microinverter (Enphase) or power optimizer (SolarEdge), or a manufacturing defect. Check for visible obstructions first. If the panel is clean and unshaded but still low, contact your installer for warranty service.
In Massachusetts, expect about 100-115 kWh per kW per month annually (roughly 1,200-1,380 kWh/kW/year). A typical 10 kW system produces 12,000-13,800 kWh/year. Monthly output ranges from 35-50 kWh/kW in December to 130-155 kWh/kW in June. Production varies by roof orientation, tilt, and shading.
Compare your monitoring app's monthly kWh production against your utility bill's net metering section. Your production should roughly equal your consumption plus net metering credits. A variance of 5-10% is normal due to inverter conversion losses and meter calibration. If the gap is larger, request a meter test from your utility (Eversource or National Grid).
The SMART program pays $0.03/kWh for all solar production for 20 years. Your production meter (separate from your billing meter) reports data to MassCEC automatically. You do not need to manually submit production data. However, you should compare your SMART payment statements against your monitoring app's production data quarterly to catch discrepancies.
DIY first: restart your monitoring gateway, check breakers, clear visible debris from panels, and verify your Wi-Fi is working. Call your installer if: an inverter shows a persistent error code, a panel shows zero production on sunny days with no shading, your system-wide production is 20%+ below normal, or your monitoring gateway will not reconnect after troubleshooting.
Modern solar panels degrade at 0.3-0.5% per year. A system producing 12,000 kWh in year one would produce roughly 11,400-11,640 kWh in year 10 and 10,800-11,280 kWh in year 20. Massachusetts weather (snow, ice, temperature cycling) does not significantly accelerate degradation if panels are properly installed and rated for the climate.
Low production on cloudy days is normal — expect 10-25% of sunny day output under overcast skies. Most monitoring apps compare against expected production for current weather conditions. If your app flags low production on a cloudy day but the alert clears on the next sunny day, no action is needed. Persistent low production alerts on sunny days require investigation.
Perform a comprehensive annual review each spring (March-April), before the high-production season. Check: year-over-year production trends, panel-level performance consistency, monitoring system firmware updates, physical panel condition, shading changes from tree growth, and SMART payment accuracy. Address any issues before summer to maximize annual production.
Every NuWatt installation includes monitoring setup, alert configuration, and a walkthrough of your production dashboard. We do not leave until you understand your system.