Loading NuWatt Energy...
We use your location to provide localized solar offers and incentives.
We serve MA, NH, CT, RI, ME, VT, NJ, PA, and TX
Loading NuWatt Energy...
NuWatt designs, installs, and manages solar, battery, heat pump, and EV charger systems across 9 states. One company, one warranty, one point of contact.
Get a Free QuoteThe federal solar tax credit (Section 25D) expired December 31, 2025. Every cost on this page reflects the new reality: $0 federal credit for cash or loan purchases. Compare real pricing across 9 states, see which states have the best payback, and learn the one remaining path to federal savings — Section 48/48E, with new starts placed in service by December 31, 2027.
Price Range
$2.74–$3.09/W
9 states compared
Federal Credit (25D)
$0
Expired Dec 31, 2025
Best Payback
6.4 years
New Jersey (ADI program)
Solar costs $2.74–$3.09/W across 9 states. Cheap install cost does not equal best value — state incentives and electricity rates matter more than $/W for your actual payback and savings.
Quick Answer
Solar panels cost $2.74 to $3.09 per watt across 9 states in 2026, with $0 federal tax credit for cash or loan purchases (Section 25D expired December 2025). The best value states are Rhode Island (7.3-year payback with either REG or REF — mutually exclusive), New Jersey (6.4-year payback with ADI $85.00/MWh), and Massachusetts (7.7-year payback with SMART 3.0). The only remaining federal incentive is Section 48 for lease/PPA arrangements; new starts must be placed in service by December 31, 2027.
Many popular solar cost websites — including Angi, HomeGuide, and some EnergySage pages — still show prices "after 30% federal tax credit." That credit expired December 31, 2025. If you see a solar cost estimate that subtracts 30% for a federal credit, it is wrong for any homeowner buying with cash or a loan in 2026. Every cost on this page reflects real 2026 pricing with $0 federal credit for homeowner purchases.
For context, Lawrence Berkeley National Lab's most recent national installed-cost median is $3.50/W (LBNL Tracking the Sun, Oct 2025 release using 2024 data).
As of May 2026, the national average installed cost for residential solar is approximately $3.00 per watt. This includes panels, inverters, mounting hardware, labor, permitting, and interconnection. For a typical 8 kW system, that is roughly $24,000 — the full price you pay with no federal credit to subtract.
Average Cost/Watt
~$3.00/W
Before state incentives
8 kW System
~$24,000
18-19 panels installed
Federal Credit
$0
25D expired Dec 2025
Price Change YoY
-2%
Equipment cheaper, labor up
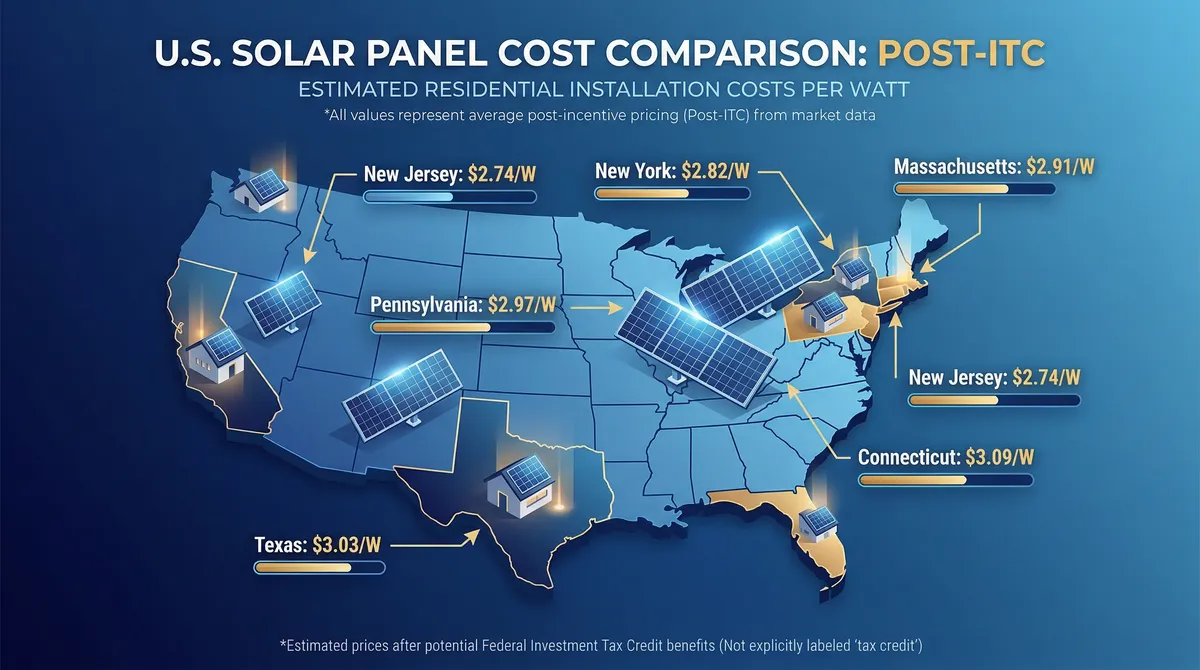
That $3.00/W national average masks significant variation. Solar in Pennsylvania costs $2.74/W while New Hampshire runs $3.09/W — a 13% spread that adds up to thousands of dollars on a typical system. But raw cost per watt only tells part of the story.
The real metric is payback period and 25-year savings. Rhode Island at $3.01/W has a 7.3-year payback thanks to its REF rebate and REG program. Pennsylvania at $2.74/W takes 10.5 years because its electricity rates are just $0.17/kWh. Cheap installation does not always mean best investment.
All 9 NuWatt states ranked by overall value (not just cost). Prices are NuWatt Hyundai 440W (entry tier) with Enphase microinverters. $0 federal credit subtracted.
8 kW Cost
$24,080
Payback
7.3 yr
25-Yr
$112K
REG 31.55¢/kWh (15 yr) OR REF $0.65/W (pick one)
8 kW Cost
$23,040
Payback
6.4 yr
25-Yr
$146K
ADI $85.00/MWh x 15yr
8 kW Cost
$24,480
Payback
7.7 yr
25-Yr
$119K
SMART $0.03/kWh x 20yr
8 kW Cost
$23,200
Payback
8.6 yr
25-Yr
$105K
Smart-E Loan 6.99-7.99% APR solar (0.99% heat-pump-only); RRES Buy-All 32.89¢/kWh
8 kW Cost
$24,720
Payback
9.2 yr
25-Yr
$97K
NEM 2.0 ~85% retail
8 kW Cost
$24,400
Payback
9.4 yr
25-Yr
$96K
Net energy billing 1:1
8 kW Cost
$21,920
Payback
10.5 yr
25-Yr
$82K
SRECs ~$30/MWh
8 kW Cost
$24,640
Payback
12.8 yr
25-Yr
$67K
GMP battery + net metering
8 kW Cost
$22,080
Payback
13.1 yr
25-Yr
$49K
Utility rebates (varies)
Costs shown are NuWatt Hyundai 440W (entry tier) pricing. Premium panels (Silfab FEOC, REC) add $0.07–$0.26/W. Payback and savings assume current electricity rates with 3.5% annual escalation. Rankings weight payback period, 25-year savings, and incentive reliability.
The 13% spread between Pennsylvania ($2.74/W) and New Hampshire ($3.09/W) is not random. Four structural factors drive state-by-state pricing differences.
Northeast labor rates are 20-40% higher than Texas or Pennsylvania. Massachusetts and Connecticut installers pay prevailing wages, electrician licensing is strict, and union coverage affects crew costs. A 2-day install in TX costs the same labor as a 1.5-day install in MA.
Highest: MA, CT, RI | Lowest: TX, PA
Some states require structural engineering stamps, fire setback calculations, and separate electrical permits. Connecticut towns often need historic review in certain districts. Texas has some of the simplest permitting in the country, often handled online.
Most complex: CT, MA | Simplest: TX
States with more solar installers per capita have lower margins. New Jersey and Massachusetts have highly competitive markets that drive prices down despite high labor costs. Less competitive rural markets in Maine and Vermont can support higher margins.
Most competitive: NJ, MA | Least: VT, ME
Northern states require snow load engineering and may need steeper tilt angles. Roof conditions in older New England homes sometimes require structural reinforcement. Texas homes often have simpler, newer roof structures that reduce installation complexity.
Most impact: ME, NH, VT | Least: TX
Many comparison sites rank states by cost per watt alone. This is misleading. Payback period and 25-year savings are what matter because they account for electricity rates, state incentives, and net metering value. Pennsylvania at $2.74/W takes 10.5 years to pay back because electricity is just $0.17/kWh. Rhode Island at $3.01/W pays back in 7.3 years because electricity is $0.29/kWh and the The REG or REF program adds thousands in value (pick one). Always compare total economics, not just sticker price.
When Section 25D expired on December 31, 2025, it removed the 30% federal tax credit that homeowners had relied on since 2006. Here is what actually changed and what it means for your solar decision in 2026.
The loss of Section 25D added roughly 2-3 years to payback periods across every state. A system that paid back in 5 years with the credit now takes 7-8 years. This is significant but does not change the fundamental math: solar electricity still costs $0.06-$0.08/kWh over its lifetime, compared to utility rates of $0.14-$0.32/kWh that rise 3-5% every year.
The states that weathered this change best are those with strong state-level incentives. Rhode Island, New Jersey, and Massachusetts barely flinched because their state programs (REF, ADI, SMART) compensate for much of the lost federal credit. States like Texas and Vermont, which rely primarily on electricity savings, saw the biggest impact.
While homeowners can no longer claim the residential ITC (25D), the commercial ITC (Section 48/48E) remains available at 30% for third-party system owners. Through a solar lease or PPA, the financing company that owns the system claims Section 48 and passes savings to you through lower monthly payments.
This is not a loophole — it is how the law was written. The system owner (a financing company, not the installer) claims the credit. You benefit through reduced monthly costs, often resulting in Day 1 savings compared to your current electricity bill.
The begin-construction safe harbor closed July 4, 2026. Projects that began construction by then locked in the full timing pathway; new starts still qualify for the 30% credit but generally must be placed in service by December 31, 2027.
8 kW system = $24,000 out of pocket (varies by state)
$0 down, lower monthly payment than your electric bill
Lease/PPA still qualifies; begin-construction safe harbor closed July 4, 2026.
With the federal credit gone, state programs are the primary way to reduce your net cost. The difference between a great state and a poor one is enormous — $97,000 in 25-year savings separates #1 New Jersey from #9 Texas.
Our ranking weights three factors equally: payback period, 25-year savings, and incentive program reliability. A state with fast payback and durable programs scores higher than one with cheap install costs but weak incentives.
Pick one: REG payments (31.55¢/kWh for 15 years on Small-Scale Solar I) OR REF rebate ($5,000 upfront) — Commerce RI prohibits pairing them. Either track stacks with ConnectedSolutions battery revenue ($225/kW). Fast 7.3-year payback despite $3.01/W cost. Property + sales tax exempt.
ADI/SREC-II ($85.00/MWh for 15 years) is the strongest production-based incentive in any NuWatt state. 6.4-year payback and $146,000 in 25-year savings. Sales + property tax exempt.
SMART 3.0 ($0.03/kWh for 20 years) + ConnectedSolutions battery DR ($275/kW/yr). Highest electricity rate ($0.30/kWh) makes solar savings enormous. 7.7-year payback.
RRES program pays 32.89¢/kWh for 20 years on the Buy-All tariff. Smart-E Loan finances solar at 6.99-7.99% APR (the 0.99% APR is a heat-pump-only special through 6/30/2026). Good net metering + 100% property tax exemption. 8.6-year payback.
NEM 2.0 credits ~85% of retail rate, locked through 2041. High electricity rate ($0.27/kWh) drives savings. No state rebate (repealed 2024), but strong community power options.
Full 1:1 net energy billing for rooftop solar. 100% property + sales tax exempt. Moderate payback (9.4 years) but strong long-term savings. Versant territory has faster payback than CMP.
Lowest install cost ($2.74/W) but lower electricity rates ($0.17/kWh) mean slower payback. SRECs add modest income ($30/MWh). Property tax exempt. Good value at the right price.
Strong net metering (1:1 retail) and GMP battery programs. However, low electricity rates ($0.20/kWh) and high install costs ($3.08/W) mean 12.8-year payback. Better with battery for DR income.
Lowest install costs nationally, but very low electricity rates ($0.14/kWh) and no statewide incentives mean the slowest payback at 13.1 years. Best with high-usage homes and utility rebates (Austin Energy, CPS).
Full breakdown by system size with cost composition analysis.
State-by-state analysis of solar economics in the post-ITC world.
How the commercial ITC works for homeowners through lease/PPA.
The honest answer for every state — with real payback numbers.
Cash vs loan vs lease/PPA: why the math flipped after the ITC expired.
How each state credits your solar production — 1:1, 85%, or worse.
Get a personalized quote for your address with your state incentives.
Calculate your exact payback period based on your state and usage.
Why domestic content panels matter for the Section 48 bonus adder.
Get a personalized quote with your state's actual incentives, tax treatment, and financing options — including the Section 48 lease path.
Get Your Free Quote →Get a personalized quote with your real state costs, incentives, and lease/PPA options — including Section 48 access before July 2026.
This article was researched and written by Sarah C., Energy Policy Analystat NuWatt Energy. All pricing data is from NuWatt's internal pricing engine using Hyundai 440W (entry tier) panels with Enphase microinverters. State incentive data was verified against official program websites as of May 2026. Payback and savings calculations assume 3.5% annual electricity rate escalation, 0.5% annual panel degradation, and current state incentive programs.