Loading NuWatt Energy...
We use your location to provide localized solar offers and incentives.
We serve MA, NH, CT, RI, ME, VT, NJ, PA, and TX
Loading NuWatt Energy...
NuWatt designs, installs, and manages solar, battery, heat pump, and EV charger systems across 9 states. One company, one warranty, one point of contact.
Get a Free Quote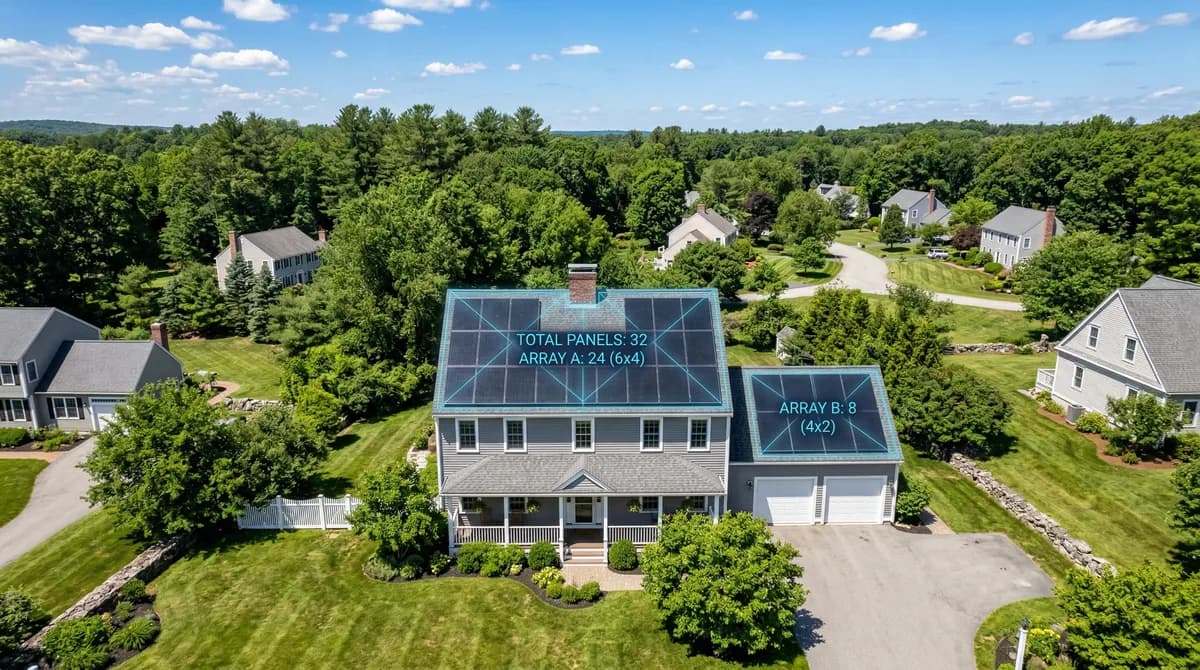
Massachusetts homes average 900 kWh/month in electricity. With 4.2 peak sun hours and 440W panels, most homeowners need 18-22 panels for an 8-10 kW system. Here is the complete sizing guide with step-by-step math.
Average MA home: 900 kWh/month = 10,800 kWh/year. Divide by MA production factor (1,200 kWh/kW/yr) = 9 kW system = ~21 panels at 440W. Adding an EV? Bump to 12 kW (27 panels). Heat pump too? Plan for 15 kW (34 panels).

This is the exact formula NuWatt engineers use to size residential solar systems across Massachusetts. It accounts for MA-specific peak sun hours, seasonal variation, and panel derate factors. Use your actual electric bill data for the most accurate result.
Check your Eversource or National Grid bill for "kWh Used." MA homes average about 900 kWh/month, but range from 350 (small condo) to 1,500+ kWh (large home with electric heat).
Multiply your monthly average by 12. MA has cold winters (lower solar, higher heating) and mild summers (moderate A/C), so annual totals smooth out seasonal swings.
Massachusetts generates about 1,200 kWh per year for every 1 kW of solar installed (using 4.2 peak sun hours x 365 days x 0.85 derate). This accounts for panel efficiency loss, inverter conversion, temperature, shading, and snow.
MA net metering caps credits at 125% of annual usage, so there is no benefit to oversizing beyond that. Most homeowners target 90-100% offset. If you plan to add an EV or heat pump, size for future usage now.
NuWatt uses 440W panels as our standard. Divide system size in watts by 440 to get panel count. Round up to the nearest whole panel.
Annual kWh / (Peak Sun Hours x 365 x Panel Watts x 0.85 derate) = Number of Panels
10,800 / (4.2 x 365 x 0.44 x 0.85) = 10,800 / 573.5 = 18.8 panels = 19 panels
The simplified version: 10,800 kWh / 1,200 kWh per kW / year = 9.0 kW. Then 9,000W / 440W = 20.5 = 21 panels. Either method yields the same result (rounding differences are 1-2 panels).
Peak sun hours measure the intensity of solar radiation and directly determine how much energy your panels produce. One "peak sun hour" equals 1,000 watts per square meter of sunlight for one hour. MA averages 4.2 hours statewide, but there is meaningful variation.
| Region | Peak Sun Hours | kWh/kW/Year | Notes |
|---|---|---|---|
| Boston / Metro | 4.3 | 1334 | Urban heat island, slight haze |
| Cape Cod / Islands | 4.4 | 1365 | Coastal clarity, excellent resource |
| Worcester / Central MA | 4.1 | 1272 | Slightly lower due to elevation/cloud cover |
| Berkshires / Western MA | 3.9 | 1210 | Mountain terrain, more overcast |
| MA Statewide Average | 4.2 | 1303 | Used in sizing calculations below |
Production factor = peak sun hours x 365 x 0.85 derate factor (accounts for inverter loss, temperature, wiring, soiling, and occasional snow cover).
Your electric bill is the fastest way to estimate system size. Divide your bill by your utility rate to get monthly kWh, then follow the sizing formula. MA rates vary widely by utility — from $0.36/kWh on Eversource up to $0.45/kWh on Unitil — so the kWh figures below are illustrative. Always read the actual “kWh Used” line on your own bill for an accurate count.
| Monthly Bill | Est. kWh/mo | System Size | Panels (440W) | Installed Cost |
|---|---|---|---|---|
| $100 | 350 | 3.5 kW | 8 | $10,500-$11,900 |
| $150 | 530 | 5 kW | 12 | $15,000-$17,000 |
| $200 | 700 | 6.5 kW | 15 | $19,500-$22,100 |
| $250 | 880 | 8 kW | 18 | $24,000-$27,200 |
| $300 | 1,050 | 10 kW | 23 | $30,000-$34,000 |
| $350 | 1,230 | 11.5 kW | 26 | $34,500-$39,100 |
| $400+ | 1,400 | 13 kW | 30 | $39,000-$44,200 |
Bill amount varies by utility
National Grid customers ($0.39/kWh) have higher bills for the same usage as Eversource customers ($0.36/kWh), and Unitil customers ($0.45/kWh) higher still. Always check actual kWh on your bill rather than just the dollar amount. Your bill's "kWh Used" line is the most accurate input for sizing.
Home square footage gives a rough estimate, but it is less accurate than using your actual kWh. A 2,000 sq ft home with gas heat uses far less electricity than the same home with electric baseboard heat. Use this table as a starting point, then refine with your actual bill data.
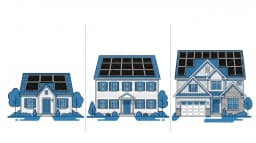
Condo / small home
Small single-family
Average MA home
Larger colonial
Large suburban
Estate / new build
Your lifestyle dramatically changes how many panels you need. An all-electric Massachusetts home (heat pump + EV + induction stove + heat pump water heater) can use nearly twice as much electricity as a home with gas appliances. Plan for your near-future usage, not just today.
Average MA home, gas heat, no EV
Base + Level 2 EV charging
Base + cold-climate heat pump
HP + EV + induction + HPWH
Beyond baseline home usage, several common additions significantly increase how many panels you need. If you plan to add any of these in the next 5-10 years, size your solar now to avoid a costly system expansion later.
250-400 kWh/month additional
200-400 kWh/month additional
150-300 kWh/month additional
200-400 kWh/month additional
100-200 kWh/month additional
50-100 kWh/month additional
South-facing: 100% production (ideal). This is what sizing calculators assume.
East or West-facing: ~85% production. Add 10-15% more panels to compensate.
Southeast or Southwest: ~95% production. Minimal difference from due south.
North-facing: ~55-65% production. Generally not recommended. Consider ground mount or a split-face design.
Higher-wattage panels mean fewer panels for the same output. NuWatt offers three tiers. All three produce the same quality electricity; the difference is efficiency, cost, and whether they qualify for FEOC (Federal Energy of Communities) bonuses under Propel financing.
| Panel | Tier | Watts | Cost/Panel | For 9 kW | For 11 kW |
|---|---|---|---|---|---|
| Hyundai 440W | Value | 440W | $700-$770 | 21 panels | 25 panels |
| Silfab 440W | FEOC | 440W | $740-$810 | 21 panels | 25 panels |
| REC 460W | Premium | 460W | $830-$900 | 20 panels | 24 panels |
Cost per panel is the fully installed cost including labor, inverter share, racking, and permitting. The REC 460W premium panel requires 1-2 fewer panels per system, which can matter on space-constrained roofs.
Massachusetts net metering (Class I, systems 25 kW AC or less) credits you at the full 1:1 retail rate for excess energy sent to the grid. However, your system cannot produce more than 125% of your annual electricity consumption.
Size to 100% of current usage + any planned additions (EV, heat pump). This maximizes savings without wasted capacity.
Beyond 125%, excess credits are paid at the much lower "avoided cost" rate at annual true-up (about $0.04-0.06/kWh vs. $0.36-$0.45/kWh retail). Oversizing wastes money.
The Massachusetts SMART program pays you $0.03/kWh for every kWh your system produces over 20 years. But this residential rate only applies to systems 25 kW AC or smaller. At 440W panels, that is approximately 57 panels maximum.
SMART income example: 10 kW system x 1,200 kWh/kW/yr = 12,000 kWh/yr x $0.03 = $360/year x 20 years = $7,200 total. This is on top of net metering savings.
Both MA utilities offer 1:1 net metering, but different rate structures affect how much you save per kWh and thus your payback period. National Grid customers pay more per kWh, meaning solar saves more per panel. This does not change how many panels you need (that is based on usage), but it does affect the financial return.
| Metric | Eversource | National Grid |
|---|---|---|
| All-In Residential Rate | $0.36/kWh | $0.39/kWh |
| Net Metering | 1:1 retail credit | 1:1 retail credit |
| True-Up Month | April | March |
| ConnectedSolutions | $275/kW summer | $225/kW summer |
| Min Monthly Bill | $7.00 | $7.00 |
| Sizing Impact | Higher rate = faster payback | Higher rate than Eversource = faster payback |
Unitil serves a small area in north-central MA (Fitchburg/Lunenburg) at ~$0.45/kWh — the highest all-in residential rate of the three MA investor-owned utilities, so each kWh offset by solar is worth the most there. Unitil does not participate in ConnectedSolutions. Separately, municipal light plants (Belmont, Braintree, Wellesley, etc.) have much lower rates ($0.14-$0.20/kWh) and do not participate in SMART 3.0.
The Section 25D residential solar investment tax credit expired December 31, 2025 under the OBBBA legislation (signed July 4, 2025). There is no federal tax credit for homeowner-purchased solar panels in 2026. This does not change how many panels you need -- it changes the cost and payback timeline. Massachusetts state incentives (SMART 3.0 + net metering + property/sales tax exemptions) still support a 7.5-9 year payback.
Third-party owned systems (leases/PPAs) can still claim the Section 48/48E commercial ITC for projects beginning construction before July 4, 2026. The benefit is passed to homeowners as a lower lease/PPA rate. Learn about Section 48 for homeowners.
The "cost per panel" includes everything: the panel itself, microinverter, racking, wiring, labor, permitting, and interconnection. Massachusetts installs cost $3.00-$3.40/W depending on system size, location, and panel tier. Here is the breakdown per panel.
NuWatt entry tier, excellent value
Required for Propel financing (FEOC)
Fewer panels needed, highest efficiency
Example: A 21-panel system using Hyundai 440W panels at $735/panel average = approximately $15,435 just for panels + labor. Total system cost including inverter, electrical, permitting, and monitoring typically comes to $27,000-$31,000 for a 9 kW system.
Our IQ Wizard uses your address, roof orientation, actual utility rates, and electricity usage to calculate the precise number of panels your home needs. No phone call required.
The average Massachusetts home uses about 900 kWh per month (10,800 kWh/year). With MA producing approximately 1,200 kWh per kW of solar per year, you need about 9 kW of solar capacity. Using standard 440W panels, that works out to 20-21 panels. Most MA homeowners install 18-22 panels to cover 90-100% of their electricity usage.
A typical 2,000 sq ft home in Massachusetts uses about 800-1,000 kWh per month. You would need approximately 8-10 kW of solar, or 18-23 panels at 440W each. The exact number depends on your insulation, heating type (gas vs. electric), number of occupants, and whether you have an EV or heat pump.
Yes. A south-facing roof in Massachusetts produces the maximum solar output. East- or west-facing roofs produce about 10-15% less energy, meaning you may need 2-3 extra panels to generate the same kWh. North-facing roofs are generally not recommended for solar. NuWatt can split panels across multiple roof faces if needed.
Level 2 EV charging adds about 250-400 kWh per month depending on driving habits (12,000-15,000 miles/year average). At 440W panels producing about 44 kWh/month each in MA, you need approximately 6-9 additional panels beyond your home baseline to fully offset EV charging. Plan ahead: if you expect to buy an EV within 5 years, size your solar system now to avoid a costly expansion later.
For residential net metering (Class I), systems must be 25 kW AC or less. This is also the cap for the SMART 3.0 residential incentive rate ($0.03/kWh for 20 years). At 440W panels, 25 kW allows up to approximately 57 panels. Most homes need far fewer. Net metering also caps credits at 125% of your annual usage, so there is no financial benefit to oversizing beyond that.
No. The Section 25D residential solar tax credit expired on December 31, 2025 under the OBBBA legislation signed July 4, 2025. There is zero federal tax credit for homeowner-purchased solar in 2026. Massachusetts state incentives (SMART 3.0, net metering, property/sales tax exemptions) remain available and make solar still financially attractive with a 7.5-9 year payback.
A cold-climate heat pump in Massachusetts adds about 200-400 kWh per month to your electricity usage (more in winter, less in summer). This translates to approximately 3-5 additional solar panels (440W each). For a home with both a heat pump and an EV, plan for 25-34 panels total (11-15 kW system) depending on home size and usage patterns.
Massachusetts averages 4.2 peak sun hours per day, which translates to about 1,200 kWh of production per kW of solar per year (accounting for the 0.85 derate factor for efficiency losses). Cape Cod gets 4.4 hours (best in MA), while the Berkshires get 3.9 hours (worst). In the Berkshires, you may need 5-8% more panels than in Boston to produce the same energy.