Loading NuWatt Energy...
We use your location to provide localized solar offers and incentives.
We serve MA, NH, CT, RI, ME, VT, NJ, PA, and TX
Loading NuWatt Energy...
NuWatt designs, installs, and manages solar, battery, heat pump, and EV charger systems across 9 states. One company, one warranty, one point of contact.
Get a Free Quote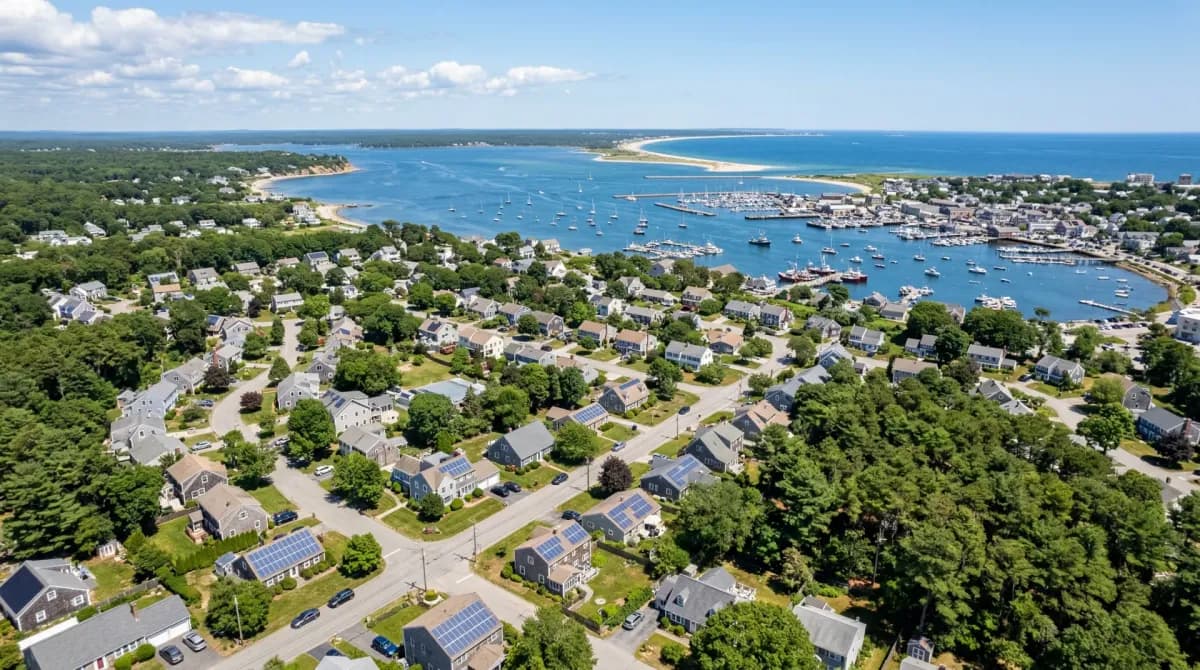
The largest town in Massachusetts by area (103 sq miles) with ~63,500 residents. From historic Plymouth Rock to the Pine Hills estates, solar works across Plymouth's diverse neighborhoods. Eversource territory at $0.36/kWh.
Eversource territory • SMART 3.0 • ConnectedSolutions eligible • Largest MA town
2026 Reality: The 30% federal tax credit (Section 25D) expired for homeowners December 31, 2025. All costs in this guide reflect $0 federal credit. Full details
A 12 kW solar system in Plymouth costs $35,400-$39,600 in 2026. In Eversource territory at $0.36/kWh, with SMART income of ~$432/yr and full retail net metering, the investment pays for itself in 6.3-7.1 years and generates ~$137,890 in savings over 25 years.
Cost Range
$2.95-$3.3/W
Fully installed
Avg System
12 kW
Plymouth average
Payback
6.3-7.1 yrs
Cash purchase
25-Year Savings
~$138K
Estimated total value
Plymouth is a sprawling coastal town of ~63,500 residents spanning 103 square miles -- the largest municipality by area in Massachusetts. The housing stock ranges from the historic waterfront district to modern Pine Hills estates, giving Plymouth one of the most diverse solar markets on the South Shore.
Population
~63,500
Median Home Value
~$525,000
Primary Utility
Eversource
Electric Rate
$0.36/kWh
Typical System Size
10-15 kW
Solar Irradiance
4.3 kWh/m²/day
Costs for different system sizes in Plymouth at $2.95-3.30/W. Plymouth homes range from smaller waterfront Capes to large Pine Hills estates requiring 18+ kW systems.
| System Size | Low Cost | High Cost | SMART 3.0 | Best For |
|---|---|---|---|---|
| 7 kW | $20,650 | $23,100 | ~$252/yr | Smaller Cape or condo |
| 9 kW | $26,550 | $29,700 | ~$324/yr | Mid-size colonial or ranch |
| 12 kW | $35,400 | $39,600 | ~$432/yr | Typical Plymouth single-family |
| 15 kW | $44,250 | $49,500 | ~$540/yr | Large home / EV + battery |
| 18 kW | $53,100 | $59,400 | ~$648/yr | Pine Hills estate / high usage |
Prices include equipment, labor, permits, and grid interconnection. No federal tax credit included (expired). $1,000 MA state tax credit not deducted. Coastal homes may add $200-500 for marine-grade racking.
Plymouth's 103 square miles encompass everything from the historic waterfront to modern planned communities. Here is how the main areas compare for solar.
Home Types
Newer construction, estates, golf community
Avg System
13-18 kW
Large modern homes with expansive roof area built from the 2000s onward. Minimal tree canopy on developed lots. High energy consumption from larger homes makes solar ROI particularly strong. Ideal for large solar arrays with battery storage.
Home Types
Historic colonials, Victorians, mixed-use
Avg System
8-11 kW
Historic waterfront area near Plymouth Rock. Some homes have historic district considerations though solar is generally permitted. Older homes may need roof evaluation. Coastal exposure can increase salt air considerations for equipment selection.
Home Types
Mix of year-round and seasonal, Cape/ranch
Avg System
10-13 kW
Coastal neighborhood with ocean views. Salt air exposure requires marine-grade mounting hardware for longevity. Battery backup is valuable given coastal storm exposure. Many seasonal homes converting to year-round use.
Home Types
Colonials, ranches, newer subdivisions
Avg System
11-14 kW
Residential suburbs with a mix of established neighborhoods and newer developments. Good roof access, moderate lot sizes. Less coastal exposure than waterfront areas. Strong solar adoption in newer subdivisions.
Plymouth note: Plymouth also includes South Plymouth, Chiltonville, Ellisville, and Long Pond areas. All Plymouth neighborhoods are in Eversource territory and eligible for the same state incentives. Contact us for a site-specific assessment.
Plymouth's Building Department handles solar permits. The process typically takes 2-4 weeks. Historic district homes near the waterfront may require additional review from the Historic District Commission.
Installer assesses roof condition, shade, orientation, and structure. Coastal or historic properties flagged for special considerations.
Application to Plymouth Building Department. Historic district homes may need additional HDC review. Standard homes: straightforward.
Typical installation 1-3 days. Electrical and building inspection by the Town of Plymouth.
Eversource approves grid connection. 2-4 weeks. Net metering and SMART enrollment activated.
Massachusetts offers one of the strongest solar incentive packages in the country. Here is what Plymouth homeowners can stack.
$0.03/kWh for all electricity produced for 20 years. A 12 kW system generates ~$432/yr in SMART income.
~$432/yr
~$8,200 over 20 years
1:1 credit at full retail rate of $0.36/kWh. Credits roll over monthly and true up in April.
~$5,170/yr
Annual electricity savings (12 kW)
Eversource demand response. Earn $275/kW summer + $50/kW winter for battery discharge during peak events.
$3,250/yr
Typical 10 kW battery
15% of system cost, capped at $1,000. Claimed on your MA state tax return (Form 1, Schedule EC).
$1,000
One-time credit
Solar systems are exempt from the 6.25% MA sales tax. Immediate savings at purchase.
~$2,344
Savings on typical system
Solar-added value is exempt from property tax for 20 years. Saves Plymouth homeowners annually on their tax bill.
~$434/yr
20-year exemption (~$8,680 total)
Note: SMART 3.0 adders can increase your income: +$0.04/kWh for battery storage, +$0.05/kWh for low-income households. Adders stack on top of the base rate.
Section 25D (the 30% residential solar tax credit) expired December 31, 2025 under the OBBBA. Plymouth homeowners buying cash or loan receive $0 in federal credit. However, third-party system owners (PPA/lease) can still claim the commercial Section 48/48E ITC -- which translates to lower PPA rates for you.
Read: What happened to the solar tax creditThree ways to pay for solar in Plymouth. PPAs offer $0 down because the third-party system owner claims the commercial Section 48 ITC. Solar loans at 5.5-8% APR through local lenders.
Upfront
~$35,400-$39,600
Monthly
$0
25-yr Savings
~$138K
Ownership
You own it
Best long-term ROI. 6.3-7.1 year payback. Full SMART income + net metering yours.
Upfront
$0 down
Monthly
~$240-340/mo (5.5-8% APR)
25-yr Savings
~$90-115K
Ownership
You own it
10-25 year terms through local lenders and credit unions. SMART income offsets monthly payments.
Upfront
$0
Monthly
Fixed ~$0.14-0.18/kWh
25-yr Savings
~$40-55K
Ownership
Third party owns
Third-party owner claims Section 48 ITC. You buy power at a discount. Immediate savings.
How Plymouth solar costs compare to neighboring South Shore and Cape communities.
| Town | Cost/W | Avg System | Utility | Notes |
|---|---|---|---|---|
| Plymouth | $2.95-3.30 | 12 kW | Eversource | Largest MA town, diverse housing, lower costs |
| Kingston | $2.95-3.30 | 11 kW | Eversource | Similar South Shore profile |
| Duxbury | $3.05-3.40 | 12.5 kW | Eversource | Affluent coastal, higher home values |
| Marshfield | $3.00-3.35 | 11.5 kW | Eversource | Coastal, similar price range |
| Carver | $2.90-3.25 | 11 kW | Eversource | Rural, cranberry bogs, lowest costs |
Solar panels in Plymouth cost $2.95-3.30 per watt installed in 2026 -- slightly lower than many inner suburbs due to easier installation logistics and newer housing stock. A typical 12 kW system costs $35,400-$39,600 before MA state incentives. The federal Section 25D residential tax credit expired December 31, 2025. Massachusetts incentives (SMART 3.0, net metering, state tax credit, and tax exemptions) make Plymouth one of the best solar value towns on the South Shore.
Plymouth benefits from several factors that lower solar installation costs: newer housing stock (especially in Pine Hills and newer subdivisions) with modern roofs requiring less prep work, easier truck access and staging compared to dense urban areas, larger lots that simplify installation logistics, and a competitive installer market serving the South Shore. These factors contribute to Plymouth landing at the lower end of the MA cost spectrum.
Coastal Plymouth neighborhoods like Manomet, White Horse Beach, and the waterfront area experience salt air exposure that can accelerate corrosion on inferior mounting hardware. We recommend marine-grade stainless steel or anodized aluminum racking for homes within about a mile of the coast. The panels themselves are sealed and unaffected by salt air. The cost premium for marine-grade hardware is modest ($200-500) and well worth the longevity protection.
Yes, and Plymouth actually has a slightly faster payback (6.3-7.1 years) than many MA towns because of its lower installation costs combined with the same high Eversource rate ($0.36/kWh) and state incentives. SMART 3.0, net metering, and tax exemptions remain fully available. Over 25 years, a typical system saves approximately $137,890.
Pine Hills and other newer Plymouth developments are ideal for solar. Modern roof construction supports panel weight without structural upgrades. Newer electrical panels often have capacity for solar interconnection without upgrades. Large roof areas on estate-style homes can accommodate 15-18+ kW systems. The combination of high energy consumption (larger homes with central AC) and lower installation costs creates some of the fastest solar paybacks in the region.
Statewide pricing and incentive overview
Complete SMART program details and enrollment
Eversource demand response program
Compare financing options for MA solar
Nearby coastal comparison
Sales and property tax benefits
Compare utility rates, net metering, and solar economics.
Track rate changes across MA utilities since 2020.
Live installation data, capacity trends, and market stats.
Current wait times, bottlenecks, and how to get connected faster.
We will assess your specific roof, neighborhood, coastal exposure, and Eversource rate to show you exactly what solar costs and saves for your Plymouth home -- including SMART 3.0 and ConnectedSolutions.