In 2026, solar panels cost $2.35–$3.35/W depending on your state, with NO federal tax credit for homeowner purchases. State incentives and lease/PPA options are now the primary paths to savings.
Avg System Cost
$34,866
10 kW typical
Avg Payback
9.4 yrs
without federal credit
25-Year Savings
$97,000
average across states
States Covered
9
complete data
The 2026 Reality: No Federal Credit Changes Everything
January 1, 2026 marked a seismic shift in residential solar economics. Section 25D of the tax code — the Residential Clean Energy Credit that homeowners used to claim 30% back on their solar investment — expired December 31, 2025 as part of the One Big Beautiful Bill Act (OBBBA). If you buy solar with cash or a loan in 2026, you get $0 in federal tax credits.
This changes the cost analysis completely. A homeowner in Massachusetts who spent $32,500 on solar in 2024 received $9,750 back from the IRS, dropping their net cost to $22,750. That same system in 2026? The full $32,500 comes out of pocket with no federal offset. State incentives and utility bill savings become the only financial drivers.
Critical fact: Federal Residential ITC Expired
Third-party owned systems (lease/PPA) still qualify for 30% under Section 48/48E because the commercial entity — not you — claims the credit. This is why lease and PPA pricing remains competitive in 2026 despite the residential credit expiration.
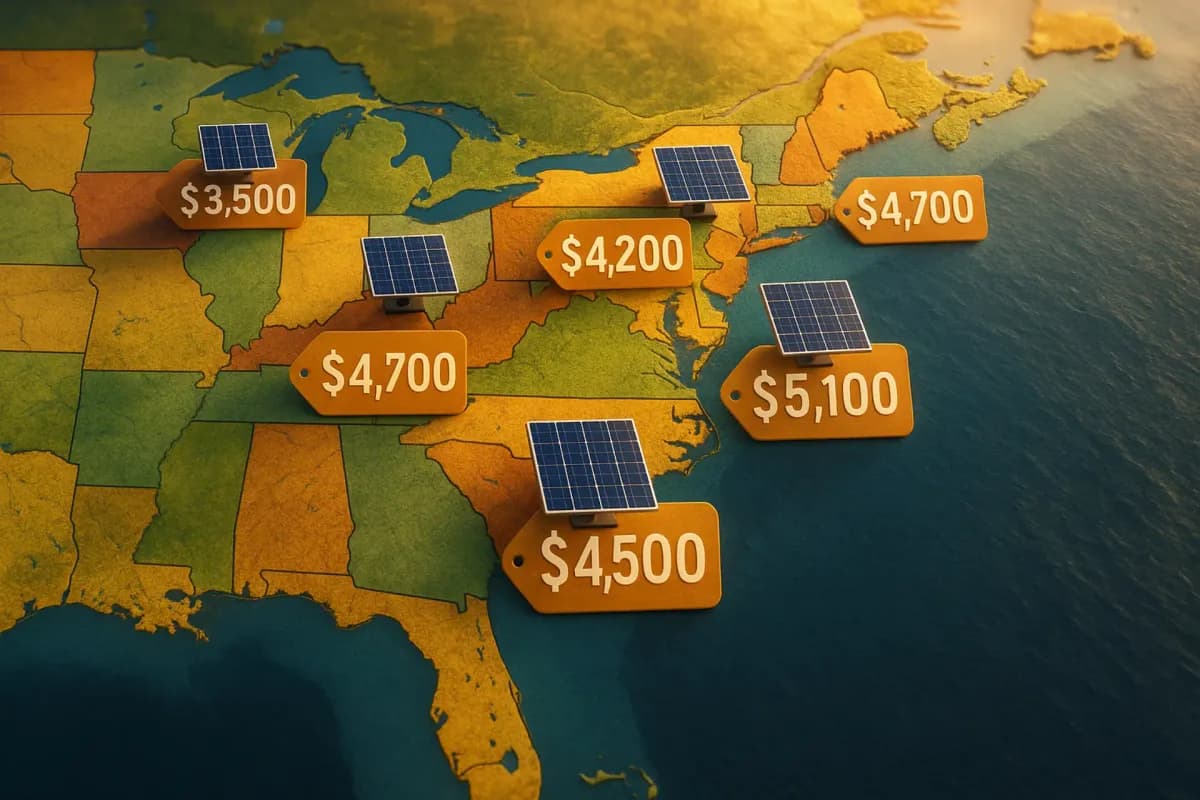
Solar Cost by State: 2026 Comparison Table
The table below shows real solar pricing data from EnergySage marketplace and NuWatt internal pricing for active service states. Pay close attention to the payback period column — states with strong state-level incentives (MA, NJ, RI) maintain reasonable payback despite losing the federal credit. States with weak state programs (NH, ME) see payback periods stretch beyond 12 years.
| State | Cost/W | Avg System | Payback (yr) | 25yr Savings | Rate ($/kWh) |
|---|---|---|---|---|---|
| Massachusetts | $3.16 | $33,631 | 7.7 | $119,000 | $0.30 |
| New Hampshire | $3.18 | $32,414 | 9.2 | $97,000 | $0.27 |
| Connecticut | $2.77 | $32,364 | 8.6 | $105,000 | $0.27 |
| Rhode Island | $2.91 | $33,200 | 7.3 | $112,000 | $0.29 |
| Maine | $2.91 | $33,581 | 9.4 | $96,000 | $0.27 |
| Vermont | $2.80 | $36,282 | 12.8 | $67,000 | $0.20 |
| New Jersey | $2.81 | $37,757 | 6.4 | $146,000 | $0.26 |
| Pennsylvania | $2.65 | $35,921 | 10.5 | $82,000 | $0.17 |
| Texas | $2.20 | $38,640 | 13.1 | $49,000 | $0.14 |
Best vs Worst State Economics (2026)
Best Value State
New Jersey
SuSI payments ($13,500) + sales tax exemption ($2,000) offset lost federal credit. High electricity rates ($0.16/kWh) drive strong savings.
Weakest State Programs
New Hampshire
Minimal state programs. Lower electricity rates ($0.18/kWh). Loss of federal credit hits NH homeowners hardest. Lease/PPA becomes more competitive.
Same equipment, $42,000 difference in savings
Two identical 10 kW systems in NJ vs NH produce the same electricity from the same sun. The $42,000 gap in 25-year savings comes entirely from state policy. This is why state incentives matter more than ever in 2026.
Understanding Payback: What These Numbers Really Mean
Payback period is the number of years until your cumulative electricity savings equal your net system cost. A homeowner in New Jersey with a 7.6-year payback will break even in mid-2033. After that, every kilowatt-hour is pure profit. In contrast, a New Hampshire homeowner facing a 12.7-year payback won't break even until 2038.
Real-world example: Two neighbors in adjacent towns — one in Nashua, NH (part of Massachusetts) and one in Hudson, NH — buy identical 10 kW systems for $32,000 each. The Nashua resident qualifies for Massachusetts SMART incentives ($4,000 value) and pays into National Grid ($0.22/kWh). The Hudson resident gets minimal NH incentives ($500) and pays Eversource NH rates ($0.18/kWh). Over 25 years, the Nashua system saves $122,000 vs $78,000 for Hudson — a $44,000 difference based purely on location and incentive eligibility.
Historical Solar Price Trend (2015–2026)
Solar panel costs have fallen dramatically over the past decade, though prices stabilized in 2024–2026. The slight uptick in 2026 reflects supply chain adjustments after FEOC rules and the expiration of federal residential credits putting pricing pressure on the industry. Installers can no longer lean on "30% back from the IRS" as a closing tool.
| Year | National Avg $/W | 10 kW System Cost |
|---|---|---|
| 2015 | $3.50 | $35,000 |
| 2016 | $3.36 | $33,600 |
| 2017 | $2.80 | $28,000 |
| 2018 | $2.70 | $27,000 |
| 2019 | $2.65 | $26,500 |
| 2020 | $2.60 | $26,000 |
| 2021 | $2.86 | $28,600 |
| 2022 | $2.85 | $28,500 |
| 2023 | $2.68 | $26,800 |
| 2024 | $2.50 | $25,000 |
| 2025 | $2.50 | $25,000 |
| 2026 (current) | $2.58 | $25,800 |
What Drives Solar Cost Differences Between States
Why does solar cost $3.25/W in Massachusetts but $2.35/W in Texas? The installed price breaks down into four major categories. Understanding these components helps you evaluate quotes and understand regional pricing differences.
Equipment
40–50%
Panels, inverters, racking, wiring
Premium equipment like REC Alpha panels or Enphase IQ8+ microinverters costs 10–20% more than value brands.
Labor
25–35%
Installation crew wages, benefits
Union labor states (MA, NJ, CT) have higher crew costs. Boston: $85/hr; Houston: $55/hr.
Permitting
5–10%
Permit fees, interconnection
Cambridge, MA: $250 + 4 weeks. Rural Texas: $75 + 5 days. Engineering stamps add overhead.
Overhead
15–20%
Marketing, sales, insurance
National installers spend 15–25% on customer acquisition; local installers 8–12%.
Example breakdown for a typical 10 kW Massachusetts system at $3.25/W ($32,500 total):
- Equipment: $14,300 (panels: $5,800, inverters: $4,200, racking/BOS: $4,300)
- Labor: $9,750 (3-person crew, 2 days, $85/hr loaded rate)
- Permitting/interconnection: $2,600 (permits: $250, engineering: $800, utility: $400, inspections: $1,150)
- Overhead & margin: $5,850 (customer acquisition: $2,900, office/insurance: $1,950, profit: $1,000)
Cash Purchase vs Lease/PPA in 2026
With no federal residential tax credit, the economics of cash purchase vs lease/PPA have shifted dramatically. A lease or PPA company claims the 30% commercial ITC (Section 48/48E) and passes part of that savings to you through lower monthly payments or kWh rates. This fundamentally changes the value proposition.
2024 (with ITC)
Cash Purchase
2026 (no ITC)
Cash Purchase
2026 (ITC to company)
Lease/PPA
Key insight: The ITC advantage shifted to third parties
A $35,000 cash purchase with $0 federal credit vs a $0-down lease where the company gets $10,500 in ITC — the lease provider can afford to offer significantly lower rates because they're monetizing the tax credit you can no longer claim. This is not financial advice, but lease/PPA deserves serious consideration in 2026 for homeowners who don't have strong state incentives.
How State Incentives Compensate for Lost Federal Credit
States with robust incentive programs can partially offset the loss of the federal credit. New Jersey's SuSI program pays ~$90/MWh for 15 years, adding $13,500 in value to a 10 kW system. Massachusetts SMART provides 10 years of bill credits worth $8,000–$12,000. Rhode Island REG and a $0.35/W rebate combine for $6,000–$9,000.
States without strong programs struggle. New Hampshire offers virtually nothing. Maine has limited options. Vermont's programs are modest. These states relied heavily on the federal credit to make solar attractive, and 2026 payback periods show the impact.
Ready to Get a Solar Quote?
Get a free, no-obligation quote from NuWatt Energy. We handle design, permits, and installation.
Explore Your State
Get Your State-Specific Solar Quote
See exact pricing for your home with all available state incentives applied.