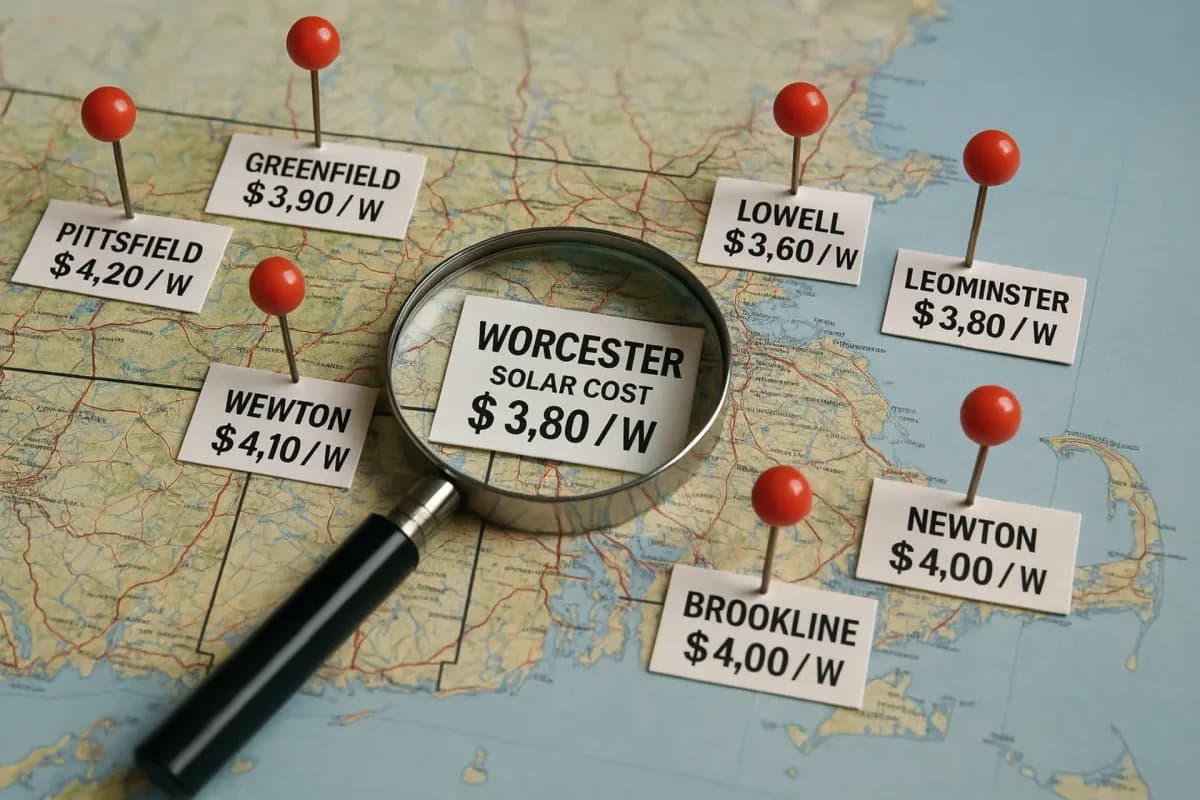
Solar costs vary 10–20% within a single state based on local permitting, utility rates, labor markets, and city-specific incentives. Here is a city-by-city breakdown for your state.
City Cost Variation
15–30%
within same state
Soft Costs
50–60%
of total system cost
Permit Fee Range
$150–$1,250
by jurisdiction
Labor Variation
±$1,000
urban vs rural
Why Your Neighbor's Solar Cost Is Different Than Yours
You live in Boston. Your friend lives in Worcester — 40 miles away in the same state. You both install identical 10 kW systems with the same panels and inverters. Your friend's system costs $2,800 less than yours. Why?
Solar costs vary dramatically within the same state. A homeowner in Hartford, CT might pay $3.10/W while a homeowner in New Haven pays $3.45/W — a $3,500 difference on a 10 kW system. The equipment is identical. The installer might even be the same company. So what drives these local cost differences?
This guide explains the four major factors that cause city-to-city cost variation, provides real examples from our service areas, and shows you how to use local cost data to estimate your payback period accurately.
The Four Factors That Drive Local Solar Costs
1. Permitting Costs and Timelines
Low-cost: Worcester, MA: $150 fee, 5-day approval
High-cost: Cambridge, MA: $450 fee + $800 engineering, 3-week approval
$1,100 difference
2. Local Utility Rates (Biggest Factor)
Low-cost: Unitil Fitchburg: $0.22/kWh → 10-year payback
High-cost: Eversource Boston: $0.28/kWh → 8-year payback
$22,500 more savings over 25 years
3. Labor Market and Cost of Living
Low-cost: Rural western MA: $35–$42/hr electrician wages
High-cost: Boston metro: $45–$55/hr electrician wages
$480–$620 on labor alone
4. City-Specific Incentives and Rebates
Low-cost: Most cities: State programs only
High-cost: Somerville, MA: +$1,000 Green Building Incentive
Stackable with state incentives
Real Example: Two Cities, Same State, $4,200 Cost Difference
Let's compare solar costs for identical 10 kW systems in Hartford and Greenwich, Connecticut — two cities 45 miles apart.
Hartford vs Greenwich, CT (10 kW System)
Hartford, CT (Lower Cost)
$26,280
($2.63/W)
Utility: Eversource Hartford — $0.22/kWh
Permit fee: $180
Labor cost: $2,100 (moderate wages)
Equipment + overhead: $24,000
City incentives: None
Annual savings: 12,000 kWh × $0.22 = $2,640
Payback period: 10 years
Greenwich, CT (Higher Cost)
$27,825
($2.78/W)
Utility: Eversource Greenwich — $0.24/kWh (higher tier)
Permit fee: $425 (includes historical district review)
Labor cost: $2,800 (NYC metro wages)
Equipment + overhead: $24,000 (same)
Engineering stamp: $600 (required for coastal areas)
Annual savings: 12,000 kWh × $0.24 = $2,880
Payback period: 9.6 years
Analysis
- • Cost difference: $1,545 ($27,825 − $26,280) despite being in the same state with the same equipment.
- • Why Greenwich costs more: Higher permit fees (+$245), higher labor costs (+$700), mandatory engineering (+$600).
- • Why Greenwich still makes sense: Higher utility rate ($0.24 vs $0.22) means $240/year more in savings. Over 25 years, the Greenwich system saves $6,000 more despite costing $1,545 more upfront.
Ready to Get a Solar Quote?
Get a free, no-obligation quote from NuWatt Energy. We handle design, permits, and installation.
City-by-City Breakdowns by State
Select your state to see detailed cost data for the top cities, including local utility rates, permitting timelines, and city-specific incentives:
Massachusetts
12 cities • $3.16/W avg • $0.30/kWh
View city breakdownConnecticut
10 cities • $2.98/W avg • $0.27/kWh
View city breakdownRhode Island
8 cities • $3.06/W avg • $0.29/kWh
View city breakdownNew Hampshire
8 cities • $3.03/W avg • $0.27/kWh
View city breakdownVermont
8 cities • $3.05/W avg • $0.20/kWh
View city breakdownMaine
8 cities • $2.86/W avg • $0.27/kWh
View city breakdownNew Jersey
10 cities • $3.05/W avg • $0.18/kWh
View city breakdownPennsylvania
10 cities • $2.61/W avg • $0.20/kWh
View city breakdownTexas
12 cities • $2.35/W avg • $0.14/kWh
View city breakdownUnderstanding Soft Costs: Where Your Money Actually Goes
Many homeowners assume 80–90% of their solar cost goes to equipment (panels, inverters, racking). The reality: equipment is only 40–50% of total cost. The rest is "soft costs" — and this is where local variation happens.
Typical 10 kW System Cost Breakdown ($32,000 total)
Equipment (41%)
Soft Costs (59%)
Where Local Variation Happens
Equipment costs are identical nationwide (panels ship from the same factory). Soft costs vary by city: Installation labor: ±$1,000 depending on local wages. Permitting and engineering: ±$800 depending on jurisdiction requirements. Sales and marketing: ±$1,500 (national companies spend 2–3× more than local installers). Total variation from soft costs: $3,300 for the same equipment. This is why you see $2.80/W in some cities and $3.50/W in others.
How to Use City Data to Estimate Your Payback
Once you know your city's average cost and utility rate, you can estimate your payback period before getting a formal quote.
Step-by-Step Payback Calculation
Find your city's cost range
Check the state-specific breakdown for your city. Example: Boston, MA averages $3.15/W.
Estimate system size
Divide your annual kWh usage by 1,200. If you use 12,000 kWh/year: 12,000 ÷ 1,200 = 10 kW system.
Calculate gross cost
10 kW × 1,000 W/kW × $3.15/W = $31,500
Subtract incentives
Massachusetts SMART program saves ~$4,500 over 10 years (net present value). Net cost: $31,500 − $4,500 = $27,000.
Calculate annual savings
12,000 kWh × $0.28/kWh (Boston Eversource rate) = $3,360/year
Calculate payback
$27,000 ÷ $3,360 = 8.0 years
Adjusting for Your Specific Situation
- • High shading: Reduce production estimate by 10–20%. This increases payback by 1–2 years.
- • Time-of-use rates: If you have TOU rates and can shift usage to solar hours, increase savings by 10–15%.
- • Battery storage: Add $10,000–$12,000 to upfront cost. Battery extends payback by 3–5 years unless you have TOU rates or demand charges.
- • Future electric vehicle: Add 3,000–5,000 kWh/year to usage. Increases annual savings by $660–$1,400 and improves payback.
How to Negotiate Using Local Cost Data
Armed with local cost data, you can negotiate more effectively. Here's how to use it.
Scenario: You Receive a Quote Above Local Average
Your quote: $36,000 for 10 kW in Providence, RI ($3.60/W)
Local average: $3.20/W (per this guide)
Difference: $4,000 above average
What to say: "I appreciate your quote, but I'm seeing that the average cost in Providence is around $3.20/W for similar systems. Your quote is $3.60/W. Can you explain the $4,000 difference? Is this premium equipment, extended warranty, or something else?"
How to Use This Data
- Find your state and city in the breakdown
- Note the cost range ($/W) and your local utility rate
- Check for any city-specific incentives on top of state programs
- Use the cost range and rate to estimate your payback period
- Get a precise quote from NuWatt for your exact address and roof
Get City-Specific Solar Pricing
Enter your address for an instant estimate based on your exact location, utility, and roof.