Loading NuWatt Energy...
We use your location to provide localized solar offers and incentives.
We serve MA, NH, CT, RI, ME, VT, NJ, PA, and TX
Loading NuWatt Energy...
NuWatt designs, installs, and manages solar, battery, heat pump, and EV charger systems across 9 states. One company, one warranty, one point of contact.
Get a Free QuoteThe residential solar tax credit is gone. Every dollar of your system cost comes out of your pocket. That makes comparing quotes the single most important step in going solar — and most homeowners skip it.
3+
Quotes Minimum
20-30%
Savings from Comparing
20-30%
Hidden Dealer Fees
$/W
Key Comparison Metric

Start with this framework, then run the financed option through our dealer fee calculator before you sign. If you want a human review, NuWatt can give you a second opinion on the quote details that marketplaces usually do not verify: utility assumptions, roof constraints, and change-order risk.
Through 2025, the 30% federal tax credit acted as a cushion — even an overpriced system felt manageable when Uncle Sam covered nearly a third. That cushion is gone. In 2026, your quoted price IS your net cost. Every dollar of difference between quotes comes directly out of your wallet.
20-30%
Average savings when comparing 3+ quotes vs. accepting the first offer. On a $32,000 system, that's $6,400-$9,600 saved.
$0.40-$0.80/W
Typical price spread between the highest and lowest quote for the same home. On an 8kW system, that's $3,200-$6,400 difference.
47%
Of homeowners who went solar with the first company that knocked on their door paid above-market rates. Don't be one of them.
NuWatt tip:We encourage you to get competing quotes. If our pricing isn't competitive, we want to know. Start your free quote →
Every legitimate solar quote should contain these 10 items. If any are missing, ask — or walk away.
| Line Item | What It Means | What to Look For |
|---|---|---|
| System Size (kW) | Total DC capacity of the array. Determines how much electricity the system can produce. | Match to your actual electricity usage (pull your last 12 months of bills). Bigger is not always better — oversizing wastes money. |
| Panel Model & Count | Specific brand, model, wattage, and number of panels. Determines quality, efficiency, and degradation rate. | Named brand + model (not "400W Tier 1 panel"). Check warranty length. FEOC-compliant if using third-party financing. |
| Inverter Type & Model | Converts DC from panels to AC for your home. String inverters are cheaper; microinverters offer panel-level optimization. | Named brand + model. Enphase IQ8+ or SolarEdge for residential. 12-25 year warranty standard. |
| Price per Watt ($/W) | Total system cost divided by system size in watts. The single most important comparison metric. | All-in $/W including permits, labor, hardware. 2026 range: $2.80-$3.60/W for residential. Below $2.50 = hidden fees likely. |
| Total System Cost | The full price you pay before any financing. In 2026, this IS your net cost — there is no residential federal tax credit. | Cash price clearly stated. If financed, the total should match cash price (difference = dealer fees). |
| Annual Production (kWh) | Estimated first-year electricity production. Based on system size, roof orientation, shading, and local irradiance. | Should be based on a site-specific shade analysis (not just satellite). Cross-check with PVWatts (NREL tool). Production ratio: 1,100-1,400 kWh/kW in the Northeast. |
| Financing Terms | Cash, loan (APR, term, dealer fee), lease/PPA (monthly payment, escalator, buyout), or Propel (TPO with fixed rate). | Total cost of financing over 25 years. Loan dealer fees disclosed. PPA escalator rate (avoid >2%). Propel fixed monthly disclosed. |
| Warranty Coverage | Three separate warranties: panel product (defects), panel performance (degradation), and workmanship (installation quality). | Panel: 25-30 year product + 25 year performance (≥84% at year 25). Inverter: 12-25 years. Workmanship: 10-25 years from installer. |
| Permits & Interconnection | Building permit, electrical permit, utility interconnection application, and inspection fees. | Confirm these are included in the quoted price. Typical: $500-$1,500 total. Some installers add these as "change orders" after signing. |
| Installation Timeline | Days from contract signing to Permission to Operate (PTO). Includes design, permitting, installation, inspection, and utility approval. | 60-120 days is normal. Under 45 days = possible corner-cutting. Over 180 days = backlog or disorganization. Get milestones in writing. |
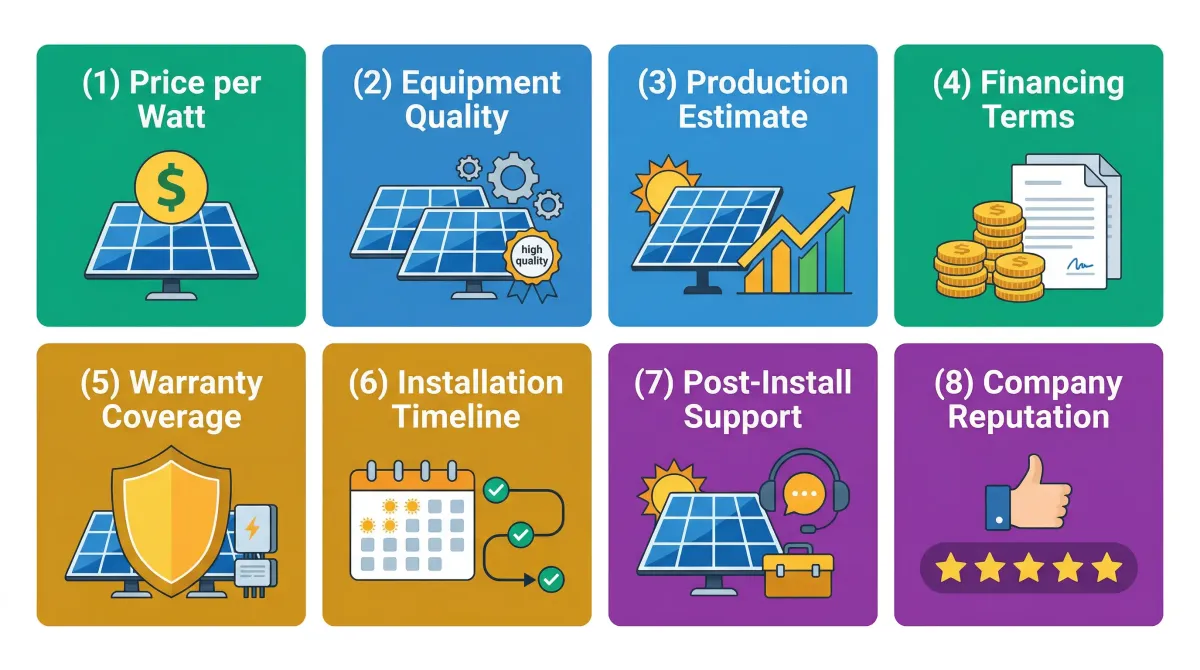
Use these eight criteria to evaluate every quote you receive. Each point includes a healthy range and a red flag to watch for.
The single most important metric. Divide total system cost by system size in watts. This must be the ALL-IN price: panels, inverter, racking, labor, permits, and interconnection. Any quote that excludes line items is inflating this number.
Good: $2.80-$3.60/W all-in (Northeast, 2026)
Red flag: Below $2.50/W usually means hidden dealer fees or low-quality equipment. Above $4.00/W means overpriced unless premium equipment.
Panel tier, inverter brand, and racking system directly affect production, warranty protection, and long-term reliability. Entry-tier panels save money upfront but may degrade faster. Premium panels cost more but produce more over 25 years.
Good: Named panel brand + model. 25+ year product warranty. Enphase or SolarEdge inverter. IronRidge or Unirac racking.
Red flag: "Tier 1 panels" without naming the brand. Generic or unbranded inverter. No racking details. Missing spec sheets.
The estimated annual kWh production should be based on a site-specific analysis — not a generic assumption. Look for shade analysis documentation, roof orientation, tilt, and the tool used (PVWatts, Helioscope, Aurora). Inflated production estimates make the payback period look shorter than reality.
Good: 1,100-1,400 kWh per kW installed (Northeast). Based on actual site survey with shade report.
Red flag: Production ratio above 1,500 kWh/kW in the Northeast. No shade analysis. "Based on similar homes in your area." No methodology disclosed.
With no residential ITC in 2026, financing is where the biggest cost differences hide. Loan dealer fees of 20-30% get baked into principal. PPA escalators compound annually. Lease buyouts can exceed system value. Compare the 25-year total cost across all quotes — not just the monthly payment.
Good: Cash price clearly stated. Loan APR 6-9% with dealer fee disclosed. PPA escalator ≤1.5%. Propel: fixed rate, no escalator.
Red flag: Loan total significantly higher than cash price (dealer fee hidden). PPA escalator >2.5%. No buyout terms disclosed. "Same as cash" claims.
Three warranties matter: panel product (manufacturing defects), panel performance (degradation guarantee), and workmanship (installation quality). The workmanship warranty is the most important because it covers what the installer actually did. A company that offers only 5 years of workmanship warranty is telling you something.
Good: Panel: 25-30 yr product, 25 yr performance (≥84%). Inverter: 25 yr. Workmanship: 15-25 yr from installer.
Red flag: Workmanship warranty under 10 years. No written performance guarantee. "Manufacturer warranty only." Installer has been in business fewer years than their warranty covers.
From contract to Permission to Operate (PTO), a typical residential install takes 60-120 days. This includes engineering design, permitting, installation, inspection, and utility interconnection. Delays beyond 120 days suggest backlog, permitting issues, or disorganization.
Good: 60-120 days contract to PTO. Written milestones for design, permit, install, inspection. Weather contingency clause.
Red flag: "We can install next week" (corners being cut). Over 180 days with no clear explanation. No written timeline or milestones.
What happens after installation matters as much as the install itself. Monitoring setup, annual production reports, warranty claim handling, and maintenance availability. Companies that disappear after PTO leave you troubleshooting alone when issues arise.
Good: Free monitoring included. Annual production review. Warranty claim handling on your behalf. Local service team.
Red flag: Monitoring requires paid subscription. No process for production issues. "Call the manufacturer directly." Out-of-state support center.
Years in business, number of local installations, reviews, and licensing tell you whether this company will be around in 10 years. The Sunnova bankruptcy in 2025 left thousands of customers stranded. Prioritize financial stability, local presence, and verifiable track record.
Good: 10+ years in business. 500+ local installs. NABCEP certified. Google rating ≥4.5. Active in your state.
Red flag: Less than 3 years in business. No local office. Can't provide local references. Only national reviews (no state-specific). Aggressive door-to-door sales.
The price on your solar quote is not always the price you pay. These costs are frequently omitted, understated, or added after you sign.
Rolled into your loan principal. A $32,000 system becomes a $38,400-$41,600 loan. Never appears on a separate line item. The single biggest hidden cost in residential solar.
Compounds every year for 25 years. A $0.10/kWh rate with 2.9% escalator reaches $0.20/kWh by year 25. Your "savings" can disappear entirely if utility rates don't rise as fast as the escalator.
If your home has a 100A or 150A electrical panel, solar may require an upgrade to 200A. Some quotes include this; many add it as a "change order" after contract signing.
If the inverter or electrical panel is far from the array, trenching or extended conduit runs add cost. Ground-mount systems almost always require trenching.
Building permits, electrical permits, utility interconnection application. Most reputable installers include these, but some don't — check the fine print.
Some companies charge monthly for production monitoring. Others include it free. Over 25 years, a $15/month subscription costs $4,500.
Prevents animals from nesting under panels. Not always needed, but often recommended. Some installers include it; others upsell after installation.
If shade analysis reveals nearby trees impacting production, trimming or removal may be recommended. This is almost never included in the solar quote.
See exactly how dealer fees affect your loan: Dealer Fee Calculator →
With Section 25D dead, financing changes everything. Cash and loan buyers get $0 in federal tax credits. Lease/PPA and Propel owners can claim the Section 48 commercial ITC as third-party system owners. Here's how each option stacks up.
| Factor | Cash Purchase | Solar Loan | Lease / PPA | Propel (TPO) |
|---|---|---|---|---|
| Ownership | You own immediately | You own from day 1 | Company owns the system | Propel owns, you benefit |
| Upfront Cost | Full system cost ($28K-$38K) | $0 down typical | $0 | $0 |
| Monthly Cost | $0 | $150-$280/month | $80-$180/month (may escalate) | Fixed rate — no escalator |
| Federal ITC | $0 — Section 25D expired Dec 2025 | $0 — Section 25D expired Dec 2025 | Section 48 ITC goes to third-party owner — may reduce your rate | Section 48 ITC goes to Propel — built into your rate |
| 25-Year Total Cost | $28,000-$38,000 | $45,000-$70,000 (with interest + dealer fees) | $24,000-$54,000 (varies by escalator) | Fixed total — varies by system size |
| Best For | Maximum long-term savings. Shortest payback period. | Ownership without large upfront payment. | No upfront cost, no maintenance responsibility. | Fixed monthly savings. FEOC-compliant equipment. No escalator risk. |
| Watch For | None — straightforward purchase. | Dealer fees (20-30%) hidden in principal. Compare loan total to cash price. | Escalator clauses (2-3%/yr). Buyout terms. Transfer on home sale. 25-year lock-in. | Only available in select states. Requires Silfab FEOC panels. |
Important: The Section 48 ITC is claimed by the third-party system owner (the financing company), not the homeowner and not the installer. This benefit may be passed through to you as a lower rate. Learn how Propel works →
Short answer: it depends on how you're financing. Here's how NuWatt's three panel tiers compare — and when each makes sense.
| Spec | Entry — Hyundai HiE-S440VG | Mid / FEOC — Silfab SIL-440-BG | Premium — REC Alpha Pure-RX 460 |
|---|---|---|---|
| Wattage | 440 | 440 | 460 |
| Price vs Base | -$0.07/W | Base price | +$0.19/W |
| Efficiency | 22.07% | 22.20% | 23.30% |
| Warranty | 25 yr product / 25 yr performance | 30 yr product / 30 yr performance | 25 yr product / 25 yr performance |
| Annual Degradation | 0.40%/yr | 0.35%/yr | 0.25%/yr |
| FEOC Compliant | No | Yes — required for Propel | No |
| Best For | Cash or loan purchases where upfront cost is the priority. Maximum panels-per-dollar. | Third-party financing (Propel, lease, PPA). Best balance of quality, warranty, and FEOC compliance. | Limited roof space (higher watts/panel). Maximum 25-year production. Lowest degradation. |
Cash or loan purchase where minimizing upfront cost is the priority. Plenty of roof space for extra panels. No third-party financing that requires FEOC compliance.
Limited roof space where every watt per panel counts. Maximum 25-year production and lowest degradation. Homeowner who values long-term output over upfront savings.
FEOC note:If you're using Propel or any third-party ownership model where the financing company claims the Section 48 ITC, FEOC-compliant panels (Silfab) are required after July 4, 2026. For cash or loan purchases, FEOC compliance is not a factor.

If you see any of these in a solar quote or during the sales process, proceed with extreme caution — or walk away entirely.
A legitimate quote itemizes panels, inverter, racking, labor, permits, and interconnection separately. If the quote is a single number with no breakdown, you cannot compare it to anything.
Any company that gives you a price from a satellite image alone is guessing. Roof condition, electrical panel capacity, shade, attic access, and conduit routing all affect cost. No site visit = inaccurate quote.
High-pressure sales tactics are a hallmark of predatory operators. Solar equipment costs do not change overnight. Legitimate companies give you weeks to decide.
If a company only shows you a monthly payment and refuses to disclose the cash system price, they are hiding dealer fees or inflated pricing. Every quote should include the cash purchase price.
The Section 25D residential solar tax credit expired December 31, 2025. Anyone telling you that you get a 30% tax credit on a cash or loan purchase in 2026 is either lying or dangerously uninformed.
In the Northeast, realistic production is 1,100-1,400 kWh per kW installed. A quote promising 1,600+ kWh/kW is inflating numbers to make the payback look faster.
The workmanship warranty covers the installer's work — roof penetrations, wiring, racking. A company that won't guarantee their own work for at least 10 years is a risk you should not take.
A company installing solar in your state should have dozens of local customers willing to be references. "We don't share customer information" is code for "we don't have happy local customers."
Deeper dive on predatory solar: Predatory Solar Contracts: 9 Red Flags →
There's no single right answer — each channel has genuine strengths and weaknesses. Here's an honest comparison.
| Factor | Local Installer (NuWatt) | Marketplace (EnergySage, etc.) | National Company |
|---|---|---|---|
| Pricing Model | Direct — no middleman markup | Competitive bidding drives price down | Volume-based, but often higher $/W |
| Equipment | Selected for your region and roof | Varies by installer in network | Standardized, limited options |
| Install Crews | In-house, trained team | Third-party installers | Subcontracted local crews |
| Accountability | Local office, face-to-face service | Marketplace intermediary layer | Call center, limited local presence |
| Workmanship Warranty | 25-year workmanship standard | Varies — check each installer | Varies — often shorter workmanship |
| Post-Install Support | Local monitoring + maintenance | Depends on winning installer | Remote monitoring, phone support |
| Key Tradeoff | Smaller geographic coverage | Good for price comparison research | Scale and brand recognition |
Our honest take: Marketplaces like EnergySage do a genuine service by making price comparison easy. We recommend using them as a research tool alongside quotes from local installers. The best approach is comparing marketplace bids against local companies to find the right balance of price, quality, and accountability.
Use this table to compare up to 3 quotes side by side. Fill in each row from your actual proposals.
| Criteria | Quote 1 | Quote 2 | Quote 3 |
|---|---|---|---|
| Company Name | ________ | ________ | ________ |
| System Size (kW) | ________ | ________ | ________ |
| Panel Model & Count | ________ | ________ | ________ |
| Inverter Model | ________ | ________ | ________ |
| Price per Watt ($/W) | ________ | ________ | ________ |
| Total Cash Price | ________ | ________ | ________ |
| Est. Annual Production (kWh) | ________ | ________ | ________ |
| Financing Type & Terms | ________ | ________ | ________ |
| Dealer Fee (if loan) | ________ | ________ | ________ |
| Total 25-Year Cost | ________ | ________ | ________ |
| Panel Warranty (product/perf) | ________ | ________ | ________ |
| Inverter Warranty | ________ | ________ | ________ |
| Workmanship Warranty | ________ | ________ | ________ |
| Installation Timeline | ________ | ________ | ________ |
| Monitoring Included? | ________ | ________ | ________ |
| Years in Business | ________ | ________ | ________ |
| NABCEP Certified? | ________ | ________ | ________ |
| Local References Available? | ________ | ________ | ________ |
Get a transparent, line-item quote from NuWatt — then compare it against every other offer you receive. No pressure, no games, no hidden fees.