Loading NuWatt Energy...
We use your location to provide localized solar offers and incentives.
We serve MA, NH, CT, RI, ME, VT, NJ, PA, and TX
Loading NuWatt Energy...
NuWatt designs, installs, and manages solar, battery, heat pump, and EV charger systems across 9 states. One company, one warranty, one point of contact.
Get a Free Quote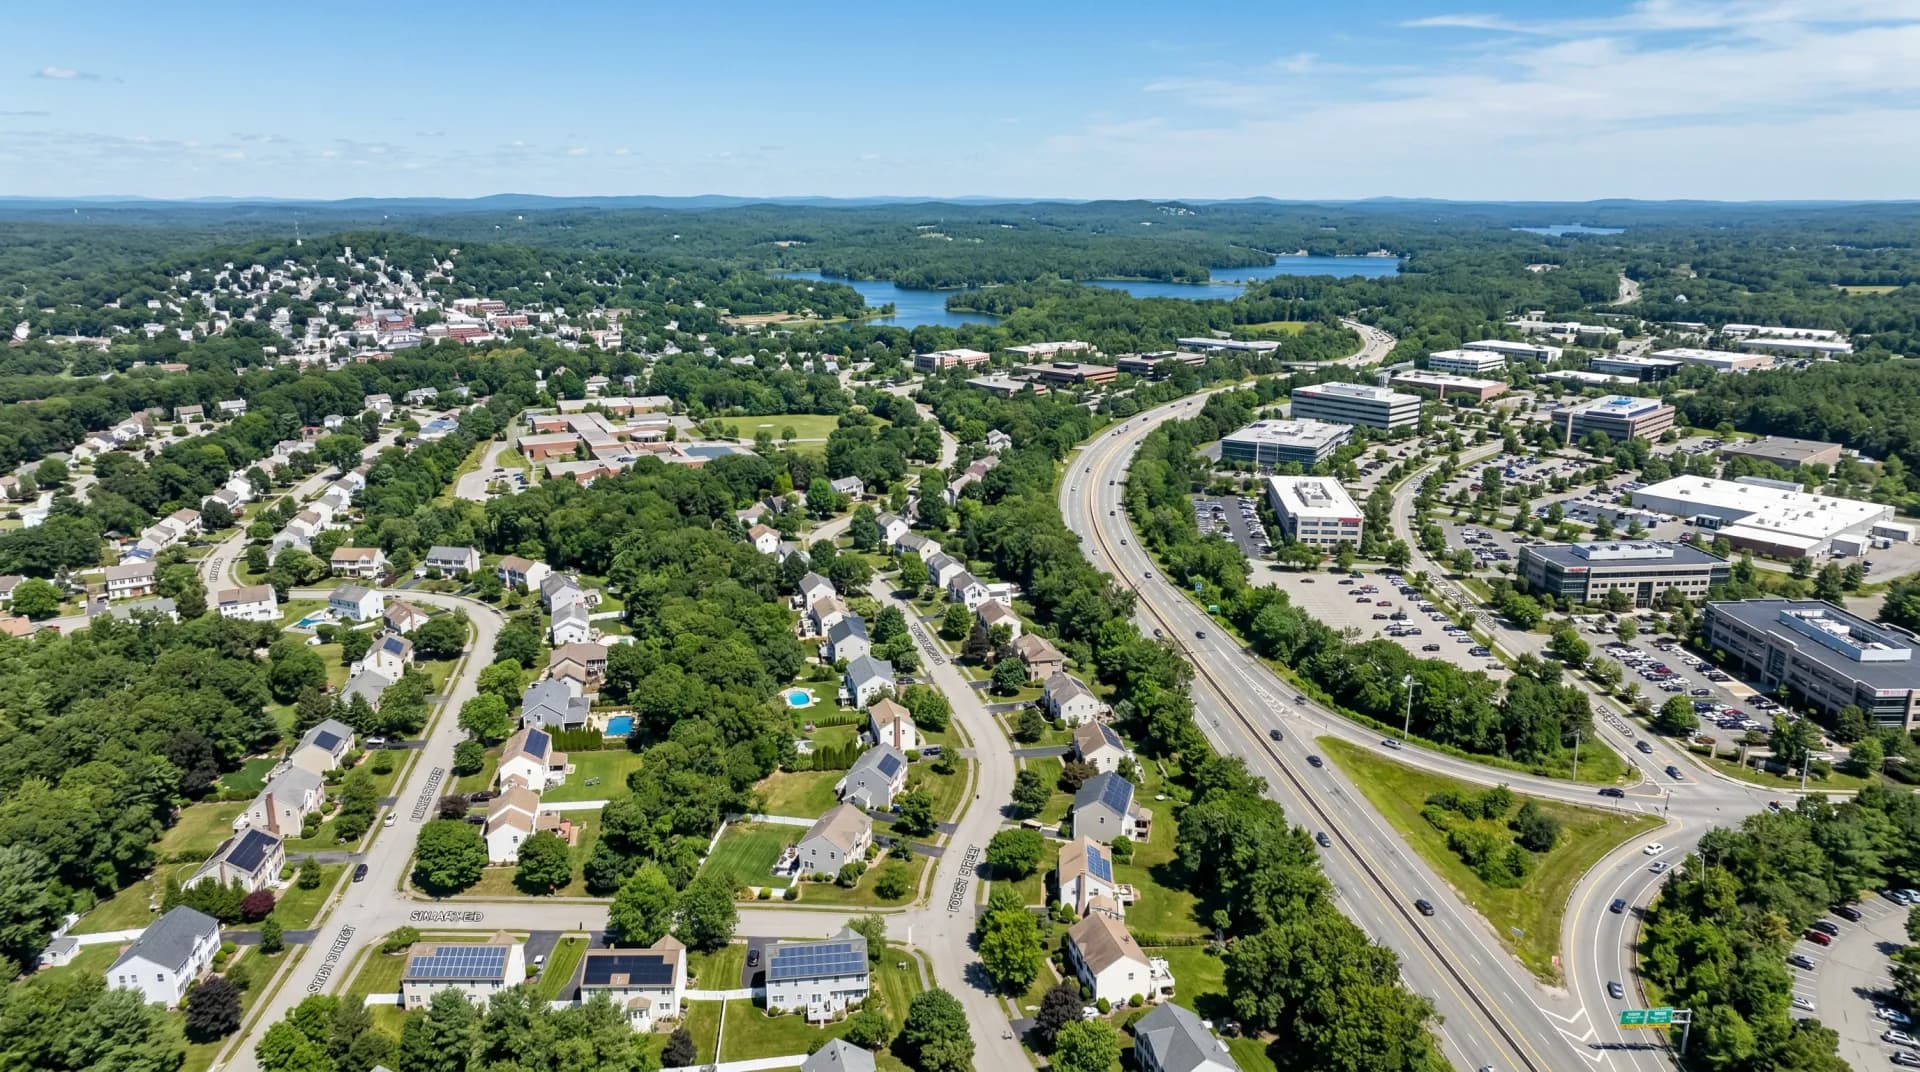
MetroWest tech-corridor city with ~41,600 residents. Eversource territory at $0.2836/kWh. SMART 3.0 + ConnectedSolutions. Strong solar economics driven by high utility rates and moderate installation costs.

Eversource territory • SMART 3.0 • ConnectedSolutions eligible • MetroWest
2026 Reality: The 30% federal tax credit (Section 25D) expired for homeowners December 31, 2025. All costs in this guide reflect $0 federal credit. Full details
A 12 kW solar system in Marlborough costs $35,400-$39,600 in 2026. In Eversource territory at $0.2836/kWh, with SMART income of ~$432/yr and full retail net metering, the investment pays for itself in 7-8.5 years and generates ~$120,000 in savings over 25 years.
Cost Range
$2.95-$3.3/W
Fully installed
Avg System
12 kW
Marlborough average
Payback
7-8.5 yrs
Cash purchase
25-Year Savings
~$120K
Estimated total value
Marlborough is a MetroWest city of ~41,600 residents situated along the I-495 technology corridor. With a mix of historic downtown charm and modern suburban development, it offers moderate solar installation costs, high Eversource electricity rates, and strong tech-sector homeowner demand.
Population
~41,600
Median Home Value
~$480,000
Primary Utility
Eversource
Electric Rate
$0.2836/kWh
Typical System Size
10-14 kW
Solar Irradiance
4.2 kWh/m²/day
Costs for different system sizes in Marlborough at $2.95-3.30/W. MetroWest pricing sits between gateway-city rates and inner-suburban premiums.
| System Size | Low Cost | High Cost | SMART 3.0 | Best For |
|---|---|---|---|---|
| 7 kW | $20,650 | $23,100 | ~$252/yr | Condo or smaller home |
| 9 kW | $26,550 | $29,700 | ~$324/yr | Mid-size cape or colonial |
| 12 kW | $35,400 | $39,600 | ~$432/yr | Typical Marlborough home |
| 14 kW | $41,300 | $46,200 | ~$504/yr | Larger home / EV + battery |
| 17 kW | $50,150 | $56,100 | ~$612/yr | High usage / heat pump + EV |
Prices include equipment, labor, permits, and grid interconnection. No federal tax credit included (expired). $1,000 MA state tax credit not deducted.
Marlborough neighborhoods range from the historic downtown to tech-corridor suburbs. Solar suitability varies by area.
Home Types
Newer subdivisions, colonials, contemporary
Avg System
12-15 kW
Tech-corridor area with newer construction from the 1990s-2010s. Larger homes with clean roof lines and minimal shading. Many homeowners work in the MetroWest tech sector and are early solar adopters.
Home Types
Victorians, mixed-use, condos
Avg System
8-11 kW
Historic downtown with mixed residential and commercial. Some older roofs need evaluation. Condo and multi-family properties can benefit from shared solar or community solar subscriptions.
Home Types
Single-family, ranches, raised ranches
Avg System
11-14 kW
Residential neighborhoods near Lake Williams with spacious lots. Mix of 1960s-1980s homes with good roof access. Some lakefront properties may have tree canopy to manage.
Home Types
Single-family, capes, split-levels
Avg System
10-13 kW
Family-oriented area along the Route 20 corridor. Mostly postwar construction with straightforward rooflines. Good southern exposure on many properties. Growing EV adoption driving larger system sizes.
Marlborough Building Department handles solar permits. The process typically takes 2-3 weeks. The city has a pro-development stance that extends to residential solar.
Installer evaluates roof, shading, and electrical capacity. Marlborough homes generally have good access. Tech-corridor homes often have higher electrical loads ideal for larger systems.
Application to Marlborough Building Department with electrical and structural plans. Standard building permit process.
Typical installation 1-3 days. Electrical and building inspection by city inspector.
Eversource approves grid connection. 2-4 weeks typical. Net metering and ConnectedSolutions enrollment activated.
Marlborough gets the full Massachusetts incentive package plus Eversource ConnectedSolutions -- one of the strongest incentive stacks in the state.
$0.03/kWh for all electricity produced for 20 years. A 12 kW system generates ~$432/yr.
~$432/yr
~$8,200 over 20 years
1:1 credit at full retail rate of $0.2836/kWh. Among the highest net metering rates in MA.
~$4,084/yr
Annual electricity savings (12 kW)
Eversource demand response: $275/kW summer + $50/kW winter for battery discharge during peak events.
$3,250/yr
Typical 10 kW battery
15% of system cost, capped at $1,000. Claimed on your MA state tax return.
$1,000
One-time credit
Solar exempt from 6.25% MA sales tax. Immediate savings at purchase.
~$2,344
Savings on typical system
Solar-added value exempt from property tax for 20 years.
~$360/yr
20-year exemption (~$7200 total)
Marlborough is in Eversource territory, which offers the highest ConnectedSolutions rates in MA. Tech-sector homeowners are increasingly pairing solar with batteries for both ROI and backup power.
Summer Revenue
$2,750
$275/kW x 10 kW battery
Winter Revenue
$500
$50/kW x 10 kW battery
Total Annual Revenue
$3,250
10 kW battery in Eversource
Marlborough tip: With SMART 3.0 battery adder (+$0.04/kWh) stacking on top of ConnectedSolutions ($3,250/yr), a battery can pay for itself in 3-4 years. Popular with tech-sector homeowners pairing solar + battery + EV charger.
Three ways to pay for solar in Marlborough. High Eversource rates mean fast payback on cash and strong savings on all options.
Upfront
~$35,400-$39,600
Monthly
$0
25-yr Savings
~$120K
Ownership
You own it
Best long-term ROI. 7-8.5 year payback. Full SMART income + net metering + ConnectedSolutions yours.
Upfront
$0 down
Monthly
~$235-320/mo (5.5-8% APR)
25-yr Savings
~$70-90K
Ownership
You own it
10-25 year terms. SMART income and ConnectedSolutions revenue offset monthly payments significantly.
Upfront
$0
Monthly
Fixed ~$0.14-0.18/kWh
25-yr Savings
~$35-50K
Ownership
Third party owns
Third-party owner claims Section 48 ITC. You buy power at a discount vs. Eversource $0.2836/kWh rate.
Section 25D (the 30% residential solar tax credit) expired December 31, 2025 under the OBBBA. Marlborough homeowners buying cash or loan receive $0 in federal credit. Third-party system owners (PPA/lease) can still claim the commercial Section 48/48E ITC.
Read: What happened to the solar tax creditMarlborough sits at the heart of the I-495 tech corridor, creating unique advantages for solar adoption.
Higher-than-average EV adoption drives demand for solar + charging
Tech-sector workforce comfortable with energy monitoring technology
Newer homes with larger roof areas ideal for 12-15 kW systems
Higher energy consumption from home offices boosts solar ROI
Strong contractor competition along the I-495 corridor
Smart home integration popular among local homeowners
Many Marlborough homeowners pair solar with EV charging. A 12-14 kW solar system covers typical home usage plus 10,000-12,000 miles of annual EV driving, eliminating both electricity and gasoline costs.
| City/Town | Cost/W | Avg System | Utility | Notes |
|---|---|---|---|---|
| Marlborough | $2.95-3.30 | 12 kW | Eversource | MetroWest tech corridor, ConnectedSolutions |
| Framingham | $3.00-3.35 | 11 kW | Eversource | Larger neighbor, similar economics |
| Sudbury | $3.10-3.45 | 13 kW | Eversource | Higher-end suburb, larger homes |
| Hudson | $2.90-3.25 | 11 kW | Eversource | Smaller neighbor, similar pricing |
| Northborough | $2.90-3.25 | 12 kW | National Grid | NGrid territory, slightly lower rate |
Solar panels in Marlborough cost $2.95-3.30 per watt installed in 2026 -- slightly below metro-Boston averages thanks to easier access and less complex installations. A typical 12 kW system costs $35,400-$39,600 before state incentives. The federal Section 25D residential tax credit expired December 31, 2025. Massachusetts state incentives (SMART 3.0, net metering, ConnectedSolutions, and tax exemptions) make solar highly profitable.
Yes. Marlborough is in Eversource territory, which offers the highest ConnectedSolutions rates in Massachusetts. Battery owners earn $275/kW in summer and $50/kW in winter for participating in demand response events. A typical 10 kW home battery earns $2,750 summer + $500 winter = $3,250/year. Combined with the SMART battery adder (+$0.04/kWh), batteries can pay for themselves in 3-4 years.
Marlborough offers a strong combination: Eversource rates ($0.2836/kWh, among the highest in the state), moderate installation costs ($2.95-3.30/W, below Newton or Wellesley), and full access to ConnectedSolutions for battery storage. The tech-sector workforce (many commuters to the I-495 corridor) shows high adoption of solar plus EV charging. The city has a 7-8.5 year payback period and ~$120,000 in 25-year savings.
Yes. Marlborough has a fast 7-8.5 year payback driven by Eversource high rates, SMART 3.0 income ($432/yr), and ConnectedSolutions battery revenue ($3,250/yr). Over 25 years, a typical 12 kW system saves approximately $120,000. The MA state tax credit ($1,000), sales tax exemption (~$2,344), and 20-year property tax exemption provide additional value.
Marlborough sits at the heart of the I-495 MetroWest tech corridor, home to companies in software, biotech, and advanced manufacturing. This creates a population of relatively affluent, technology-oriented homeowners who adopt solar and EVs at higher rates than the state average. Many newer homes in east Marlborough were built during the tech boom with larger roof areas and higher energy consumption -- ideal for 12-15 kW solar systems.
We will assess your roof, Eversource rate, and battery potential to show you exactly what solar costs and saves for your Marlborough home -- including SMART 3.0 and ConnectedSolutions.
Complete hub for MA solar, heat pumps, and utility resources.
Statewide solar costs and city-by-city breakdown.
$0.03/kWh for 20 years. How to enroll and earn.
Earn $225-$1,500/yr per battery. Eversource demand response.
1:1 retail credit for Eversource customers.
Cash, loan, and PPA options compared.
25D expired. What options remain for homeowners.
Compare utility rates, net metering, and solar economics.
Track rate changes across MA utilities since 2020.
Live installation data, capacity trends, and market stats.
Current wait times, bottlenecks, and how to get connected faster.