Loading NuWatt Energy...
We use your location to provide localized solar offers and incentives.
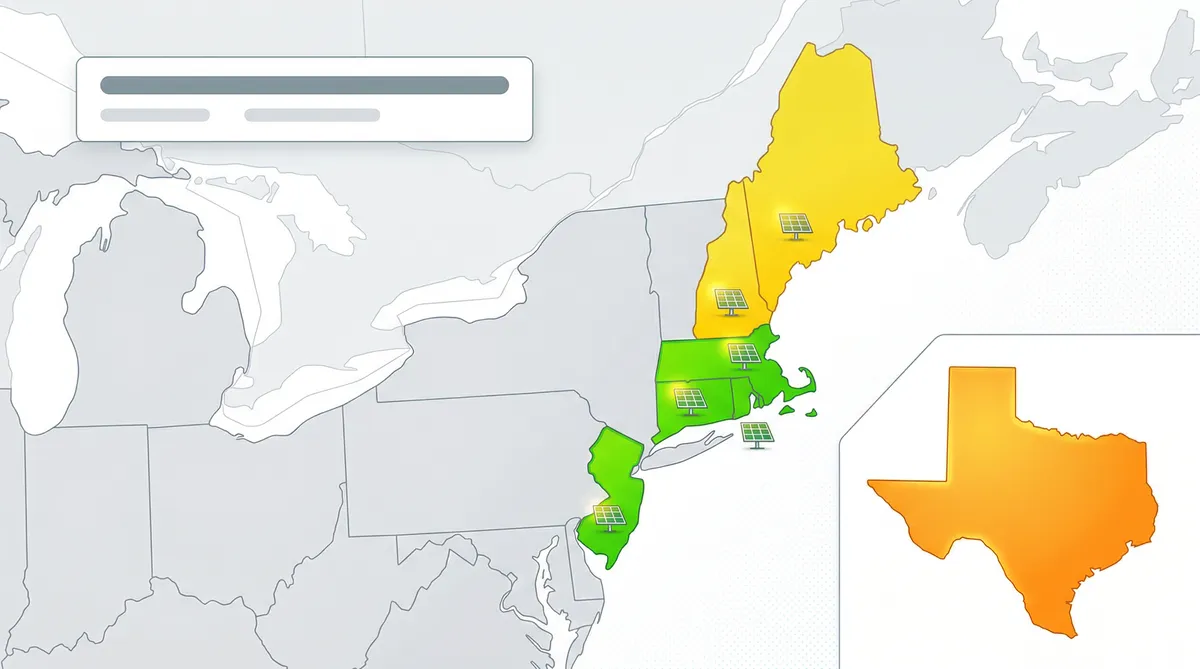
We serve MA, NH, CT, RI, ME, VT, NJ, PA, and TX
Loading NuWatt Energy...
NuWatt designs, installs, and manages solar, battery, heat pump, and EV charger systems across 9 states. One company, one warranty, one point of contact.
Get a Free Quote
The federal tax credit is dead. Most solar websites still pretend it exists. Here are the real numbers — the good, the bad, and what actually matters for your wallet in 2026.
Quick Answer
Solar panels in 2026 still reduce electricity bills by 80-100% and provide 25+ years of savings, but the federal residential tax credit (Section 25D) expired December 31, 2025 — meaning cash/loan buyers receive $0 in federal credits. Upfront costs are $20,000-$30,000 with payback of 9-14 years depending on state. The strongest cases are in high-rate states (MA, RI, CT, NJ) with state incentives. Section 48E lease/PPA options still offer $0-down solar with the commercial ITC — new starts placed in service by Dec 31, 2027.
Most solar websites inflate the pros and bury the cons. They still quote the “30% federal tax credit” even though it expired in December 2025. They show payback calculations based on incentives that no longer exist. We use your actual utility rate, real state incentive data, and honest cost projections — not inflated savings based on a tax credit that is gone. If solar does not make sense for your situation, we will tell you that too.
Eight real advantages of going solar in 2026 — with actual numbers, not marketing fluff.
In MA, $0.33/kWh becomes $0 with solar.
An 8kW system in Massachusetts produces approximately 9,600 kWh per year — enough to eliminate a $260/month electric bill entirely. At $0.33/kWh, that is $3,168 in year-one savings. Even in lower-rate states like Texas ($0.15/kWh), solar eliminates $1,440-1,800 per year in electricity costs. Over 25 years, these savings compound as utility rates rise.
MA, RI, NJ, CT have programs worth $5K-20K+.
While the federal tax credit is gone, many states have robust incentive programs: Massachusetts SMART 3.0 pays $0.03/kWh for 20 years (~$5,760 on an 8kW system). New Jersey ADI pays $85.00/MWh for 15 years (~$12,885). Rhode Island combines REF ($0.65/W, up to $5,000) with REG ($0.27/kWh for 15-20 years). Connecticut offers 1:1 net metering plus sales and property tax exemptions. These state programs often match or exceed the value of the old 30% federal credit.
LBNL: solar adds ~4% to home sale price.
Lawrence Berkeley National Laboratory studied over 22,000 home sales and found that owned solar panel systems add approximately 4.1% to a home sale price — averaging $15,000-$40,000 depending on system size and market. This means a $25,000 solar investment on a $400,000 home could add $16,400 in resale value, effectively reducing your net cost to $8,600 before any energy savings. This premium is strongest in markets with high electricity rates.
Rates up 3-5% annually — solar locks your cost.
Northeast electricity rates have risen 3-5% annually on average, and this trend is accelerating. Massachusetts rates jumped from $0.22/kWh in 2020 to $0.33/kWh in 2026 — a 50% increase in six years. Solar locks in your electricity cost at approximately $0.06-0.08/kWh for 25+ years. If rates continue climbing at 4% annually, a homeowner paying $0.33/kWh today will be paying $0.72/kWh by 2046. Solar panels produce at the same cost regardless.
Finance company claims the credit — you save day one.
The residential tax credit (Section 25D) is dead, but the commercial ITC (Section 48/48E) is alive — its begin-construction window closed July 4, 2026, so new projects generally must be placed in service by December 31, 2027. Solar financing companies use this credit to offer $0-down leases and PPAs at below-market rates — typically $0.12-0.18/kWh versus utility rates of $0.26-0.33/kWh. The third-party system owner claims the 30% credit, and you benefit through a lower electricity rate. This is the most underappreciated financing option in the post-ITC landscape.
Solar + battery = power during outages.
Adding a home battery (Tesla Powerwall 3, Franklin aPower2, Enphase IQ 10C) gives you backup power during grid outages and enables participation in demand response programs like ConnectedSolutions (MA: $275/kW, RI: $225/kW summer payouts). A battery can also shift solar production to cover evening peak-rate hours, increasing your effective savings by 15-25% in markets with time-of-use rates.
Equivalent to planting 100 trees annually.
A typical 8kW residential solar system offsets approximately 4 metric tons of CO2 per year — equivalent to taking one car off the road or planting roughly 100 trees annually. Over the 25-30 year lifespan of the system, that is 100-120 tons of CO2 prevented. The carbon payback period (time to offset the emissions from manufacturing the panels) is approximately 1-3 years depending on your grid mix.
No moving parts. Production warranty guaranteed.
Modern solar panels come with 25-year production warranties guaranteeing at least 80-85% of original output at year 25. Many panels continue producing well past 30 years. There are no moving parts, no fuel costs, and minimal maintenance — typically just an annual visual inspection and occasional cleaning. Inverters may need replacement once in 25 years (micro-inverters last 25+ years). Compare this to a car that needs $10,000+ in maintenance over the same period.
Eight real disadvantages of solar in 2026 — the things most solar companies will not tell you.
$0 from Section 25D since January 1, 2026.
The Section 25D residential solar Investment Tax Credit expired on December 31, 2025 under the OBBBA signed July 4, 2025. If you purchase solar panels with cash or a loan, you receive $0 in federal tax credits. This is the single biggest change in the solar market in 2026. Previously, a $25,000 system would have qualified for a $7,500 credit — that money is simply gone for individual purchasers. Many solar companies are still advertising the "30% tax credit" in their marketing. If they quote you a price assuming the credit, run.
$20,000-$30,000 for a typical 8kW system.
Without the federal tax credit reducing costs by 30%, the full price of a residential solar system is $20,000-$30,000 for a typical 8kW installation. This varies by state: Massachusetts averages $3.00-3.40/W ($24,000-$27,200), New Jersey averages $2.90-3.30/W ($23,200-$26,400), and Texas costs vary by metro. State incentives in some states (NJ ADI, RI REF) offset $3,000-$5,000, but the upfront investment remains significant for cash buyers.
9-14 years depending on your state.
With the 30% federal credit, payback periods were 5-8 years in most states. Without it, payback stretches to 8-10 years in the best states (MA, RI with strong incentives) and 12-17 years in states without incentive programs (ME with CMP, TX). This is still a profitable investment over 25 years, but it requires patience. If you plan to move within 5-7 years, a lease/PPA may make more sense than a cash purchase.
Shade, age, and orientation matter.
Solar panels need adequate unshaded roof space facing south, southeast, or southwest. Heavy tree shading covering 40%+ of usable roof area can reduce production by 30-50%, significantly extending payback. Roofs older than 10 years may need replacement before installation ($8,000-$15,000 additional cost). Flat roofs, north-facing roofs, and complex multi-level rooflines add installation complexity and cost. A professional site assessment determines whether your specific roof is suitable.
Lower savings, no home value boost.
A solar lease or PPA gives you $0-down savings from day one, but you do not own the panels. The financing company owns the system, claims the tax credit, and charges you a monthly rate. Your 25-year savings are typically $15,000-$35,000 versus $50,000-$100,000+ with ownership. Leased systems add minimal home value (the lease obligation transfers to the buyer). You also cannot modify, move, or remove the system without the financing company's approval.
Lease transfer, net metering grandfathering at risk.
If you sell your home with a leased solar system, the lease must transfer to the buyer — some buyers may resist this. If you own the system, you benefit from home value increases, but net metering grandfathering may not transfer in all states. In Rhode Island, post-April 2023 installations receive 80% retail credit instead of 1:1. In New Hampshire, NEM 2.0 credits are approximately 85% of retail. Moving within 5 years of a cash purchase may not allow enough time to recoup your investment.
Winter = 30-50% of summer output.
Solar panels produce significantly less electricity in winter than summer. In New England, December/January production is approximately 30-40% of June/July output due to shorter days, lower sun angle, and occasional snow cover. This means your electric bill will not be $0 every month — you will likely have a net bill in winter and credits in summer. Annual net metering reconciliation handles this, but monthly variability surprises some homeowners. System sizing accounts for this by targeting annual (not monthly) offset.
PA PPL, VT, NH already reduced credits.
Net metering — the policy that credits you for excess solar production sent to the grid — is under pressure in several states. Pennsylvania PPL reduced credits significantly. Vermont has annual net metering rate reductions built into policy. New Hampshire moved to NEM 2.0 with approximately 85% retail credit instead of 1:1. Rhode Island dropped from 1:1 to 80% retail for post-April 2023 installations. While states like Massachusetts, Connecticut, and New Jersey maintain strong 1:1 net metering, the trend in some markets is toward lower compensation for exported solar electricity.
A quick comparison of the key advantages and disadvantages for a typical 8kW system.
| Factor | Pro | Con |
|---|---|---|
| Electric Bill | Reduce 80-100% ($2K-$4K/yr savings) | Winter bills still arrive (30-50% production) |
| Federal Tax Credit | Section 48E lease/PPA gets 30% ITC | Section 25D dead — $0 for cash/loan buyers |
| Upfront Cost | $0 down with lease/PPA | $20K-$30K if buying outright |
| Payback Period | 8-10 yrs in best states (MA, RI) | 12-17 yrs in states without incentives |
| Home Value | +$15K-$40K (owned systems) | Leased systems add minimal value |
| Utility Rates | Locked at $0.06-0.08/kWh for 25 yrs | Some states cutting net metering |
| Roof Requirements | Works on most roofs (S/SE/SW facing) | Shade, age, orientation can disqualify |
| Maintenance | Minimal — no moving parts, 25yr warranty | Inverter replacement once in 25 years |
| 25-Year Savings | $50K-$100K+ (owned), $15K-$35K (lease) | Requires staying in home 8-10+ years |
Solar is not one-size-fits-all. Here is our honest, state-by-state assessment for 2026.
$0.33/kWh
8-10 yrs
SMART 3.0 ($0.03/kWh, 20yr)
View state guide$0.29/kWh
8-10 yrs
REG 31.55¢/kWh OR REF $0.65/W (pick one)
View state guide$0.30/kWh
9-11 yrs
1:1 NM + tax exemptions
View state guide$0.26/kWh
10-12 yrs
ADI $85.00/MWh (15yr)
View state guide$0.27/kWh
~9.5 yrs
NEM 2.0 (~85% retail)
View state guide$0.27/kWh
12-17 yrs
1:1 NM (rooftop)
View state guide$0.15/kWh
12-15 yrs
None (high sun)
View state guideWe would rather tell you the truth and lose a sale than put a system on a roof where it does not belong.
Your utility rate is below $0.12/kWh
Payback stretches beyond 15 years. Solar is still a net positive over 25 years, but the financial case is weak.
Heavy shade covers 40%+ of your roof year-round
Trees, neighboring buildings, or dormers that block direct sunlight reduce production to the point where the investment may not make sense.
You plan to sell your home within 3 years
You will not recoup a cash investment in 3 years. A lease/PPA could work if the buyer is willing to assume it.
Your roof needs replacement within 5 years
Installing solar on an old roof means paying $3,000-5,000 to remove and reinstall panels when you reroof. Reroof first.
Your monthly electric bill is under $75
Low usage means a smaller system that does not justify installation costs. Consider a small ground-mount or wait for a future rate increase.
A solar company is quoting you the "30% federal tax credit"
This tells you they are either uninformed or deliberately misleading you. The Section 25D residential credit expired December 31, 2025. Walk away.
With the federal tax credit gone for individual buyers, the lease/PPA equation has shifted dramatically.
Best for:
Homeowners staying 10+ years with available capital
Best for:
Homeowners wanting immediate savings with no upfront cost
Timing: The Section 48/48E commercial ITC that makes $0-down leases and PPAs possible had a begin-construction window that closed July 4, 2026. New projects still qualify for the 30% credit but generally must be placed in service by December 31, 2027.
The main pros of solar panels in 2026 are: eliminating or drastically reducing electric bills (saving $2,000-4,000+ per year in high-rate states), protection from rising utility rates that increase 3-5% annually, state incentives that remain strong in MA/RI/NJ/CT, property value increases of $15,000-$40,000 per LBNL study, Section 48E lease/PPA options with $0 down, 25-30 year lifespan with minimal maintenance, and offsetting approximately 4 tons of CO2 per year.
The biggest cons of solar panels in 2026 are: the federal residential tax credit (Section 25D) expired on December 31, 2025, meaning homeowners who buy with cash or a loan get $0 in federal credit. This raises the upfront cost to $20,000-$30,000 and extends payback to 9-14 years depending on your state. Other cons include roof suitability limitations (shade, age, orientation), lease/PPA ownership trade-offs, seasonal production variation (winter = 30-50% of summer), and some utilities cutting net metering benefits.
Yes. The Section 25D residential solar Investment Tax Credit (ITC) expired on December 31, 2025 under the OBBBA. Homeowners who purchase solar panels with cash or a loan receive $0 in federal tax credits. However, the Section 48/48E commercial ITC remains available — its begin-construction window closed July 4, 2026, so new projects generally must be placed in service by December 31, 2027 — which allows solar financing companies to offer $0-down leases and PPAs at below-market rates by claiming the 30% credit themselves and passing savings to homeowners.
Yes, in most states. Solar electricity costs approximately $0.06-0.08/kWh over 25 years, compared to utility rates of $0.26-0.33/kWh in the Northeast. In high-rate states with strong incentives (MA, RI, CT, NJ), cash-purchase payback is 8-11 years with 25-year savings of $50,000-$100,000+. A lease or PPA provides savings from month one with $0 down. Solar is a longer bet in states with lower rates and no incentives (TX 12-15yr payback, NH ~9.5yr).
Without the federal tax credit, cash-purchase payback periods range from 8-10 years in high-rate states (MA, CT, RI) to 12-17 years in lower-rate states (ME, TX). Key variables are your utility rate, state incentives, system size, and roof orientation. A solar lease or PPA eliminates payback entirely because you save from month one with $0 down and the financing company claims the Section 48 ITC.
Yes. According to Lawrence Berkeley National Laboratory (LBNL), homes with owned solar panel systems sell for approximately $15,000-$40,000 more than comparable homes without solar. The premium varies by market — homes in high-rate states (MA, NJ, CT) see the highest premiums. However, leased solar systems add minimal home value because the lease obligation transfers to the buyer, which can complicate the sale process.
It depends on your financial situation and timeline. Buying solar panels maximizes 25-year savings ($50,000-$100,000+) and adds $15,000-$40,000 to home value, but requires $20,000-$28,000 upfront with an 8-14 year payback. A lease/PPA delivers savings from day one with $0 down because the financing company claims the 30% Section 48 ITC, but total 25-year savings are lower ($15,000-$35,000). If you plan to stay 10+ years and have the capital, buying wins. If you want immediate savings, a lease is smarter.
If you own your solar panels outright, they add approximately 4% to your home value and transfer with the sale — a clear selling point. If you have a solar lease or PPA, the agreement must transfer to the buyer, which can complicate negotiations. Some buyers may not want to assume the lease. You can also buy out the remaining lease balance before selling. Net metering grandfathering may or may not transfer depending on your state and utility.
Monthly savings depend on your utility rate, system size, and state incentives. In Massachusetts ($0.33/kWh), an 8kW system saves approximately $200-330 per month. In New Jersey ($0.26/kWh), savings are approximately $160-260 per month. In Texas ($0.15/kWh), savings are approximately $100-150 per month. These figures assume the system offsets 80-100% of your electricity consumption. With a lease or PPA, your savings are the difference between your current bill and the lease payment.
The best states for solar panels in 2026 are Massachusetts (SMART 3.0 + $0.33/kWh rates), Rhode Island (REG or REF — pick one — + $0.29/kWh), Connecticut (1:1 net metering + tax exemptions + $0.30/kWh), and New Jersey (ADI $85.00/MWh + $0.26/kWh). These states combine high utility rates with strong state incentives, producing 8-11 year payback periods even without the federal credit. Texas works because of low installation costs and high sun hours despite no state incentives.
Our IQ quiz uses your actual utility rate, roof data, and state incentives to calculate your real solar savings — no inflated numbers, no phantom tax credits.
State-by-state payback analysis
Read guideHow to still save without 25D
Read guideHow leases/PPAs still get the ITC
Read guideData-driven post-ITC analysis
Read guide2026 pricing for all 9 states
Read guideWhich financing wins post-ITC
Read guideRed flags in 2026 proposals
Read guideHow to evaluate installer bids
Read guideComplete resource library
Read guideSarah tracks state and federal energy incentives, utility rate structures, and rebate programs. She has helped hundreds of homeowners navigate complex incentive stacks.