Loading NuWatt Energy...

We use your location to provide localized solar offers and incentives.
We serve MA, NH, CT, RI, ME, VT, NJ, PA, and TX
Loading NuWatt Energy...
NuWatt designs, installs, and manages solar, battery, heat pump, and EV charger systems across 9 states. One company, one warranty, one point of contact.
Get a Free QuoteTexas commercial buildings have massive AC loads (50-70% of energy in summer) with afternoon peaks that align perfectly with solar production. Learn the TX-specific sizing methodology: 12-month bill analysis, 4CP demand impact, PVWatts production modeling (1,500-1,700 kWh/kW), and utility audit programs.
TX Solar Resource
1,500-1,700
kWh/kW/year
AC Load Share
50-70%
Summer energy use
Commercial Rates
$0.06-$0.11
Per kWh average
Peak Match
Excellent
Afternoon AC + solar
Sizing a commercial solar system in Texas requires a 6-step process: (1) collect 12 months of utility bills to understand seasonal consumption patterns — TX summer months show 2-3x winter usage due to AC loads, (2) analyze 15-minute interval data to map hourly load profiles, (3) evaluate peak demand and ERCOT 4CP charges that solar can directly offset, (4) assess available roof or ground area — TX buildings often have large flat roofs ideal for solar, (5) model production using PVWatts with TX-specific data (1,500-1,700 kWh/kW/year), and (6) run financial modeling including 30% ITC, MACRS depreciation, and REP buyback rates. TX commercial AC loads peak in the afternoon coincident with solar production, creating an excellent self-consumption match.
Commercial solar sizing in Texas is fundamentally different from sizing in Northeast states. The differences go beyond simple sunshine hours and affect every aspect of the sizing methodology — from load profile analysis to financial modeling. Understanding these Texas-specific factors is essential for right-sizing your commercial solar investment and maximizing return.
The most significant difference is the dominance of AC loads. In Texas commercial buildings, air conditioning accounts for 50-70% of total annual energy consumption during summer months. This creates a load profile that peaks in the afternoon — precisely when solar panels produce the most energy. This coincidence of peak demand and peak production means Texas commercial solar systems achieve higher self-consumption rates than systems in NE states, where heating loads peak in winter when solar production is lowest.
The ERCOT deregulated market introduces another sizing consideration: your Retail Electric Provider (REP) buyback rate for excess solar generation. Unlike NE states with established net metering or production-based incentive programs, Texas REP buyback rates vary dramatically — from wholesale rates (3-5 cents/kWh) to competitive plans offering near-retail rates (8-10 cents/kWh). Your buyback rate directly affects whether oversizing makes economic sense or whether you should target a lower offset percentage.
For a comprehensive overview of Texas commercial solar economics including ITC and MACRS, see our Commercial Solar in Texas 2026 guide. For detailed financial modeling, use our Commercial Solar IRR Calculator.
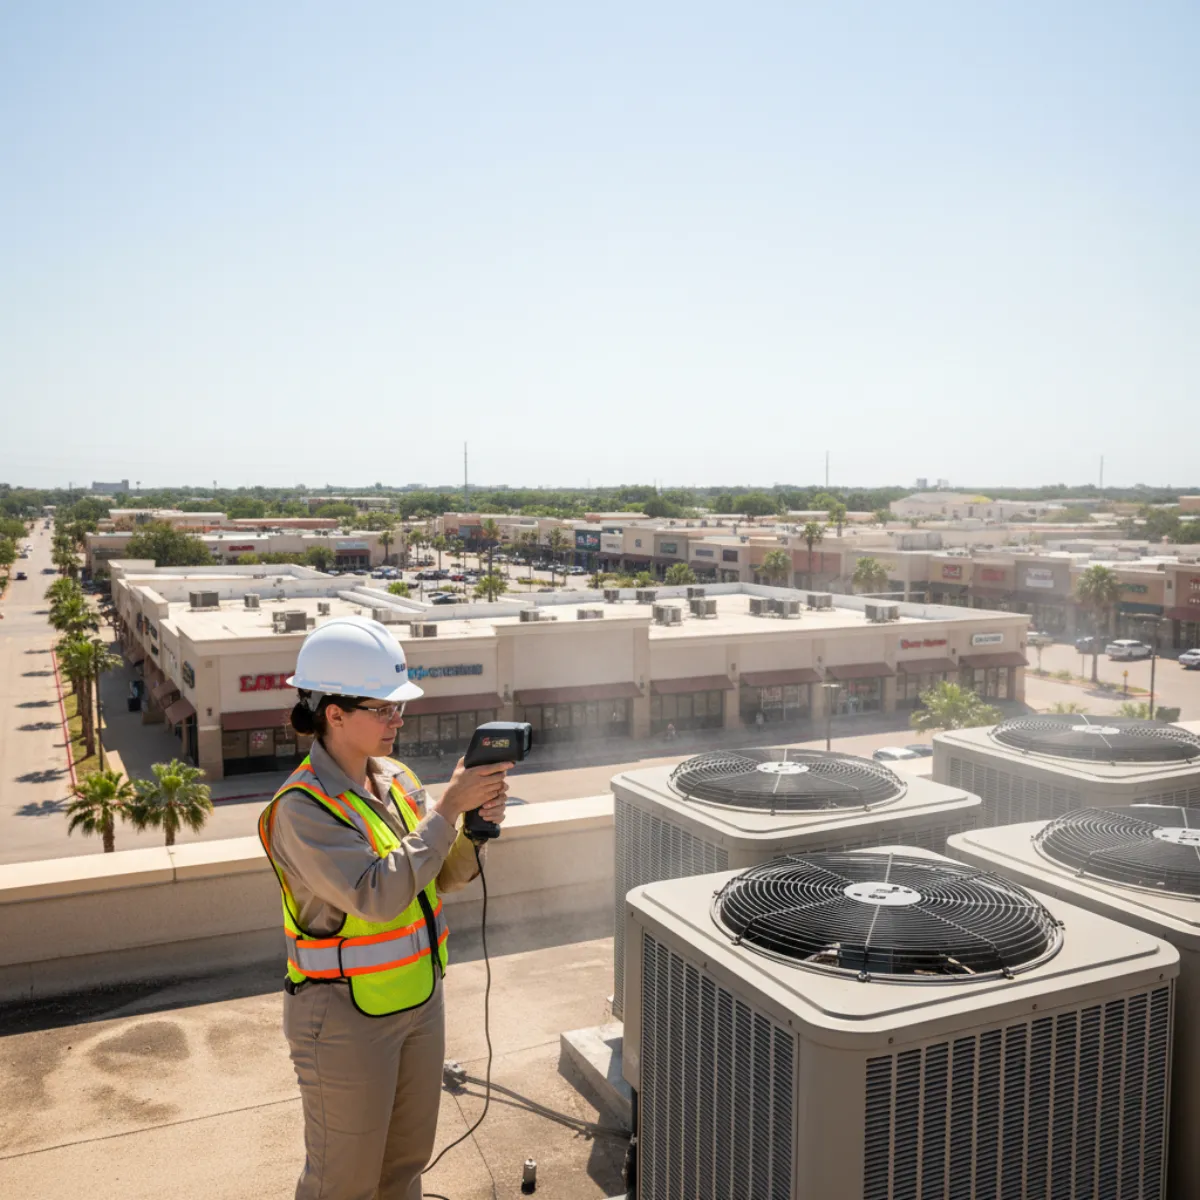
TX commercial solar sizing requires analysis of AC-dominated load profiles, 4CP demand charges, and PVWatts production modeling.
Texas commercial load profiles are dominated by cooling loads. Unlike Northeast states where winter heating drives peak consumption, Texas commercial buildings see their highest energy use from June through September when outdoor temperatures regularly exceed 100F. A typical Texas commercial building consumes 2-3 times more electricity in July than in January, with the excess almost entirely attributable to air conditioning.
This seasonality has important implications for solar sizing. A system sized to meet 100% of annual consumption will significantly overproduce in winter (when loads are low and solar production is moderate) while covering a smaller percentage in summer (when both loads and production are high). The afternoon peak of AC demand, however, coincides closely with the peak of solar production — typically 11 AM to 5 PM — creating an excellent self-consumption match during the hours that matter most.
The four coincident peak (4CP)charges from ERCOT add another dimension to the analysis. ERCOT allocates transmission costs based on each customer's demand during the four highest system-wide peak intervals each summer, typically occurring between 3-5 PM from June through September. Solar production during these afternoon windows directly reduces your 4CP exposure, providing savings of $2-$8 per kW per month in transmission charges. For a 500 kW commercial facility, 4CP savings alone can reach $12,000-$48,000 annually.
Jan
Low
Feb
Low
Mar
Med
Apr
Med
May
High
Jun
Peak
Jul
Peak
Aug
Peak
Sep
High
Oct
Med
Nov
Low
Dec
Low
TX commercial energy consumption peaks June-August, driven by AC loads. Summer months consume 2-3x more than winter months.
Follow this systematic approach to correctly size a commercial solar system in the Texas market. Each step builds on the previous one to ensure your system is optimally sized for your specific facility, utility territory, and financial objectives.
Collect all 12 months of utility bills to understand seasonal energy consumption patterns. In Texas, summer months (June-September) typically show 2-3x the energy consumption of winter months due to AC loads.
Key Data Points
Request interval data from your utility or REP. This granular data reveals your facility consumption pattern hour-by-hour, which is critical for optimal solar sizing in the TX market.
Key Data Points
ERCOT 4CP charges are based on your facility demand during the four highest system peaks each summer (typically June-September, 3-5 PM). Solar directly reduces your 4CP contribution, saving $2-$8/kW/month in transmission charges.
Key Data Points
Measure usable installation area accounting for setbacks, equipment, shading, and access pathways. TX buildings often have significantly more usable roof area than NE buildings due to single-story construction.
Key Data Points
Use NREL PVWatts to model expected solar production for your TX location. Texas solar resource is excellent at 1,500-1,700 kWh/kW/year depending on location, with South and West TX achieving the highest values.
Key Data Points
Combine production data with financial incentives to determine optimal system size. In deregulated TX, your REP buyback rate determines whether oversizing makes economic sense.
Key Data Points
Texas commercial building stock is heavily weighted toward single-story structures with large flat roofs — ideal for solar. Each building type has distinct energy patterns and sizing considerations.
Avg Building Size
50,000-200,000 sq ft
Usable Roof Area
40,000-180,000 sq ft usable
AC Load Share
30-40% of annual energy
Typical System Size
200-2,000 kW
Large flat roofs with minimal penetrations. Lighting and forklift charging are major loads. AC load is lower than office buildings because of high ceilings and fewer occupants. Ideal candidates for solar — massive unshaded roof area.
Avg Building Size
10,000-80,000 sq ft
Usable Roof Area
8,000-70,000 sq ft usable
AC Load Share
50-65% of annual energy
Typical System Size
50-500 kW
Single-story with flat or low-slope roofs. High AC load from customer comfort requirements. Peak demand coincides well with solar production. Multiple tenants may complicate metering and allocation.
Avg Building Size
80,000-200,000 sq ft
Usable Roof Area
70,000-180,000 sq ft usable
AC Load Share
45-60% of annual energy
Typical System Size
200-1,000 kW
Massive flat roofs are ideal for solar. Lighting and refrigeration are secondary loads. National chains (Walmart, Target, Costco) are already adopting solar at scale in TX. Local big-box stores can achieve similar economics.
Avg Building Size
20,000-100,000 sq ft
Usable Roof Area
15,000-80,000 sq ft usable
AC Load Share
55-70% of annual energy
Typical System Size
50-500 kW
Highest AC load percentage in TX. Multi-story buildings have less roof area per sq ft of floor space. Ground-floor offices with parking lots may benefit from carport solar. Peak AC demand drives high demand charges.
Avg Building Size
30,000-150,000 sq ft
Usable Roof Area
25,000-130,000 sq ft usable
AC Load Share
45-60% of annual energy
Typical System Size
100-500 kW
Large campuses with multiple buildings. Summer AC load is substantial even with reduced occupancy. Public schools may qualify for Direct Pay ITC (tax-exempt entities). Carport solar over parking lots provides shade for students and staff.
Texas solar production varies by region due to differences in irradiance, humidity, and cloud cover. South and West Texas enjoy the highest solar resource in the state, while the Gulf Coast sees slightly lower production due to humidity and afternoon cloud buildup. All regions significantly outperform Northeast states in total annual production.
Annual Production
1,650-1,700 kWh/kW
Avg Daily Irradiance
5.8-6.2 kWh/m2/day
Highest solar resource in TX. Desert climate with minimal cloud cover. Energy community ITC bonus may apply in Midland-Odessa.
Annual Production
1,550-1,600 kWh/kW
Avg Daily Irradiance
5.2-5.6 kWh/m2/day
Excellent solar resource. Austin Energy VoS at 9.91 cents/kWh makes this a top market. CPS Energy in SA has lower buyback.
Annual Production
1,500-1,550 kWh/kW
Avg Daily Irradiance
5.0-5.4 kWh/m2/day
Strong solar resource. Oncor territory with competitive REP market. Hail zone — consider hail-rated panels.
Annual Production
1,450-1,500 kWh/kW
Avg Daily Irradiance
4.8-5.2 kWh/m2/day
Slightly lower due to humidity and clouds. CenterPoint territory. Hurricane-zone considerations. Still 30-50% higher production than NE states.
Annual Production
1,550-1,650 kWh/kW
Avg Daily Irradiance
5.3-5.8 kWh/m2/day
Excellent resource especially inland. AEP Texas territory. Some areas may qualify for energy community bonus.
In the deregulated ERCOT market, TDUs provide energy efficiency programs but do not offer free comprehensive energy audits like some regulated utilities in other states. Third-party energy auditors are essential for solar-specific sizing analysis. Municipal utilities (Austin Energy, CPS Energy) offer more integrated services.
Commercial Solutions Program
Oncor offers commercial energy efficiency programs including lighting upgrades, HVAC optimization, and building envelope improvements. As a TDU, Oncor does not directly provide solar-specific audits, but their efficiency programs can reduce your baseline consumption before solar sizing.
Coverage
Prescriptive and custom rebates for efficiency measures
Solar Sizing Note
In deregulated territory — use third-party energy audit for solar-specific assessment.
Commercial Standard Offer Program
CenterPoint partners with ERCOT market efficiency programs providing rebates for commercial energy efficiency improvements. Their Standard Offer program provides $0.04-$0.08/kWh saved through qualified efficiency measures.
Coverage
Lighting, HVAC, motors, compressed air, and custom measures
Solar Sizing Note
Deregulated territory — third-party audit recommended for solar sizing. Reduce loads first, then size solar.
Commercial Efficiency Program
AEP Texas offers commercial efficiency programs with prescriptive and custom rebate tracks. South TX locations benefit from excellent solar irradiance (1,600-1,700 kWh/kW) but also have the highest AC loads.
Coverage
Prescriptive rebates for standard measures, custom analysis for complex projects
Solar Sizing Note
Some AEP Texas areas qualify for energy community ITC bonus (+10%). Third-party solar audit recommended.
Commercial Energy Audits
Austin Energy provides comprehensive commercial energy audits as part of their demand-side management programs. As a municipal utility, Austin Energy offers more integrated solar + efficiency planning than deregulated utilities.
Coverage
Free preliminary audits, subsidized detailed audits for commercial customers
Solar Sizing Note
Austin Energy Value of Solar (VoS) rate is 9.91 cents/kWh for 2026, making solar economics particularly strong. Muni utility handles interconnection directly.
Commercial Energy Efficiency
CPS Energy provides commercial energy efficiency rebates and audit assistance. San Antonio commercial solar economics are affected by CPS Energy avoided cost rate of 3-4 cents/kWh for excess generation.
Coverage
HVAC, lighting, and custom measure rebates
Solar Sizing Note
Lower buyback rate (3-4 cents/kWh) means sizing to self-consumption is critical. Do not oversize in CPS territory.
The optimal system size for a Texas commercial building depends on three primary factors: your REP buyback rate, available installation area, and financial objectives. Unlike states with favorable net metering, the TX deregulated market makes your export compensation rate a critical sizing variable.
Size to 70-85% of annual consumption. When your REP only credits excess generation at wholesale rates, exported kWh have low value. Size the system to maximize self-consumption and minimize export. Focus on offsetting daytime loads. This applies to many standard REP contracts and CPS Energy in San Antonio (avoided cost 3-4 cents/kWh). See our Commercial Solar Rate Calculator for rate-specific analysis.
Size to 90-110% of annual consumption. When your REP offers near-retail buyback rates, excess generation still has good value. Slightly oversizing is acceptable and provides buffer against degradation and load growth. This applies to competitive solar buyback plans from REPs like Green Mountain Energy, Chariot Energy, and others. Austin Energy VoS at 9.91 cents/kWh also supports this sizing approach.
Size solar to 100-120% + add battery storage. If your facility has significant demand charges ($8-$15/kW/month), pairing solar with battery storage for demand shaving and 4CP reduction can improve economics. The battery absorbs excess solar production during midday and discharges during peak demand hours. See our Commercial Demand Charge Battery Calculator.
Regardless of the scenario, right-sizing starts with data. A thorough energy audit with interval data analysis is the foundation. Every dollar spent on accurate assessment saves multiples in avoided oversizing or undersizing costs. For detailed ROI modeling at different system sizes, use our Commercial Solar IRR Calculator.
A commercial energy audit establishes your baseline consumption, identifies load reduction opportunities, and provides the data needed to optimally size a solar system. In Texas, where AC loads represent 50-70% of commercial energy use in summer, understanding your load profile is critical. Reducing energy waste through efficiency measures before installing solar means a smaller, more cost-effective solar system that covers a higher percentage of your optimized consumption. The audit also identifies peak demand patterns that affect 4CP charges — critical for financial modeling in the ERCOT market.
Our team provides comprehensive TX-specific energy audits and solar sizing analysis. Get data-driven sizing for maximum ROI.