Loading NuWatt Energy...
We use your location to provide localized solar offers and incentives.
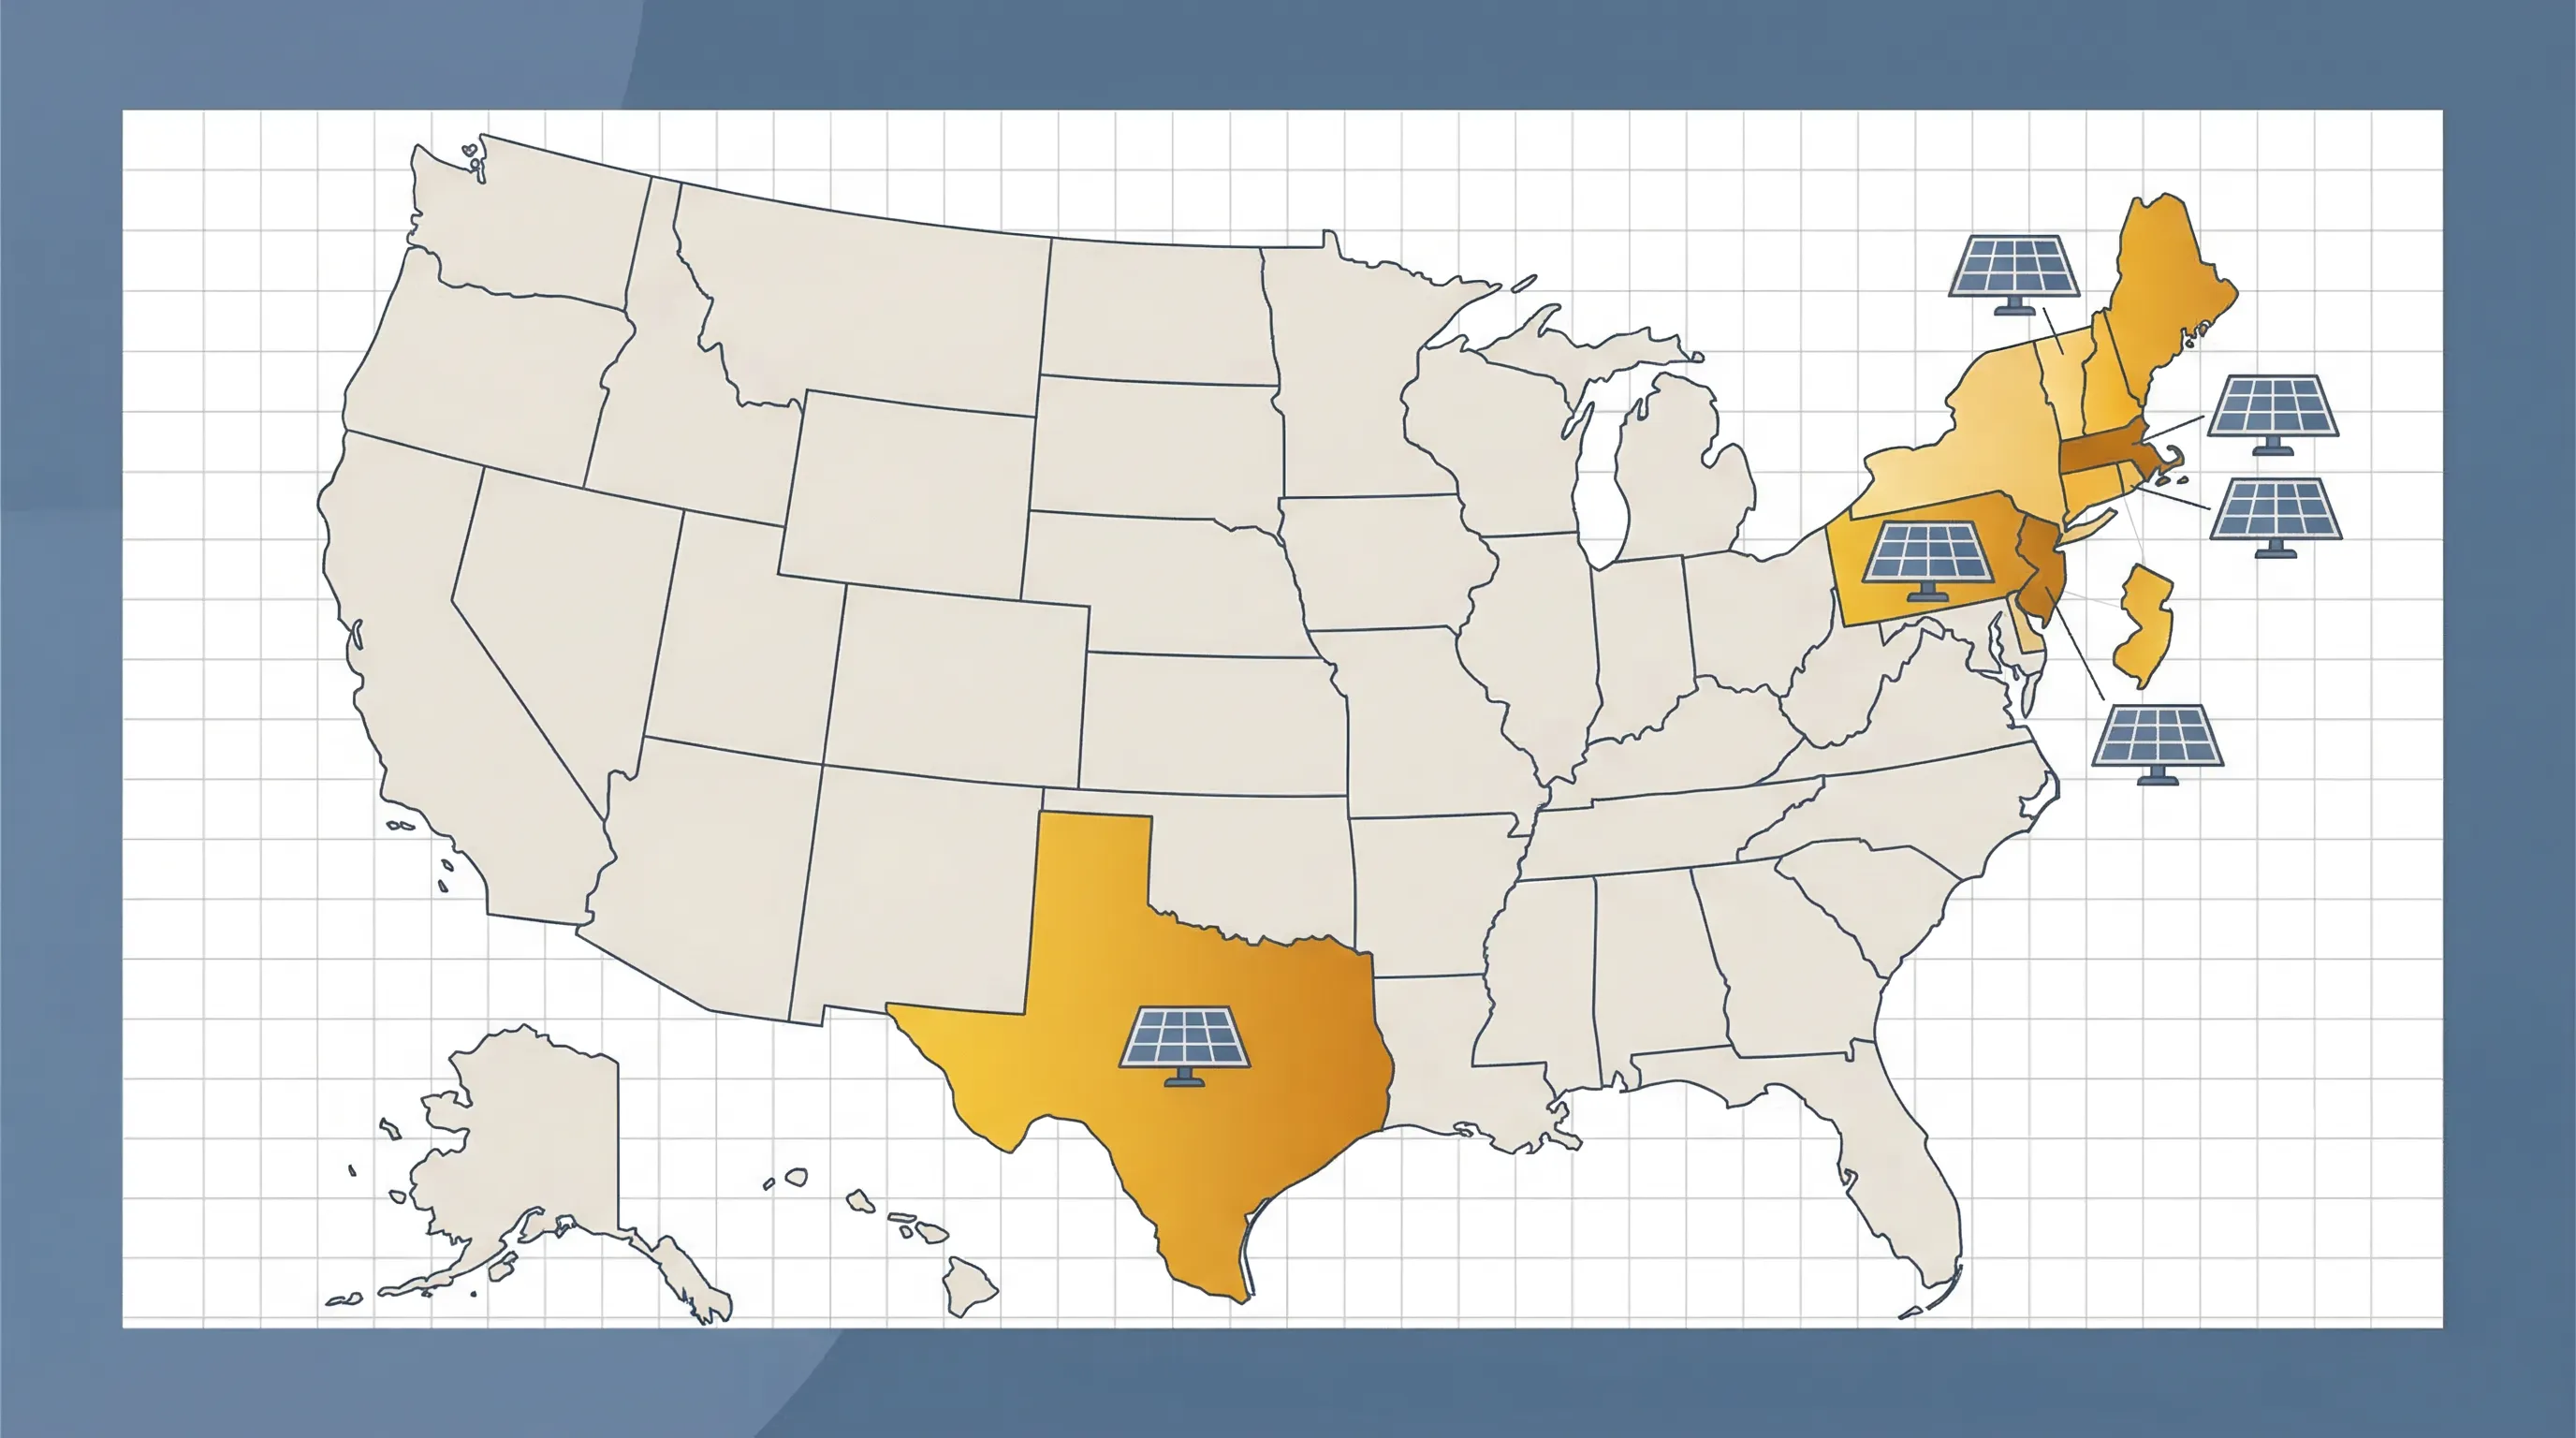
We serve MA, NH, CT, RI, ME, VT, NJ, PA, and TX
Loading NuWatt Energy...
NuWatt designs, installs, and manages solar, battery, heat pump, and EV charger systems across 9 states. One company, one warranty, one point of contact.
Get a Free QuoteThe federal solar tax credit (Section 25D) expired December 31, 2025. Homeowners buying solar with cash or a loan now pay the full price — no 30% credit to subtract. Here are the real, verified costs across 9 states and 4 system sizes, plus the one remaining path to federal savings before it closes July 4, 2026.
National Average
$2.58/W
10 kW = ~$25,800
Federal Credit (25D)
$0
Expired Dec 31, 2025
Section 48 Lease/PPA
30% ITC
Until July 4, 2026
Solar costs $2.53–$3.66/W in 2026 depending on state and system size. With no federal credit for cash/loan, the only path to federal savings is a lease/PPA (Section 48) — and that deadline is July 4, 2026.
Many popular solar cost websites — including Angi, HomeGuide, and some EnergySage pages — still show prices "after 30% federal tax credit." That credit expired December 31, 2025. If you see a solar cost estimate that subtracts 30% for a federal credit, it is wrong for any homeowner buying with cash or a loan in 2026. The costs on this page reflect real 2026 pricing with $0 federal credit for homeowner purchases.
These are full installed costs across NuWatt's 9-state service area using Hyundai 440W panels (entry tier). No federal credit subtracted — because there is none for homeowner purchases.
11–12 panels
$16,200
avg across 9 states
Range: $14,400–$18,300
Small home or low usage. Covers 400–600 kWh/month.
18–19 panels
$23,900
avg across 9 states
Range: $22,600–$25,300
Average US home. Covers 650–900 kWh/month.
22–23 panels
$28,100
avg across 9 states
Range: $25,300–$31,600
Larger home or full offset. Covers 800–1,200 kWh/month.
34–35 panels
$42,500
avg across 9 states
Range: $39,800–$46,200
Large home + EV + heat pump. Covers 1,200–1,800 kWh/month.
Sorted from cheapest to most expensive. All costs are pre-state-incentive and assume $0 federal tax credit (25D expired).
Costs shown are NuWatt Hyundai 440W (entry tier) pricing. Premium panels (Silfab, REC) add $0.07–$0.26/W. Payback and savings assume current electricity rates with 3.5% annual escalation.
While homeowners can no longer claim the residential ITC (25D), the commercial ITC (Section 48/48E) is still available at 30% for third-party system owners. Through a solar lease or PPA, the financing company that owns the system claims Section 48 and passes savings to you through lower monthly payments.
This is not a loophole — it is how the law works. The system owner (a financing company, not the installer) claims the credit. You benefit through reduced monthly costs, often resulting in Day 1 savings compared to your current electricity bill.
This window closes July 4, 2026. After that, no federal solar incentive exists for anyone — homeowner or business.
10 kW in MA = $30,600 out of pocket
10 kW in MA = ~$0/mo down, ~$120/mo payment
No lease/PPA advantage. Full price only.
Eight factors determine what you will actually pay. Understanding these helps you evaluate any quote — from NuWatt or anyone else.
Labor costs, permitting fees, and utility interconnection requirements vary significantly. Texas is cheapest ($2.53/W), New Hampshire most expensive ($3.66/W).
Larger systems have lower per-watt costs due to fixed costs (permits, design) being spread across more panels. A 15 kW system costs ~$0.30/W less per watt than a 5 kW system.
Hyundai 440W (entry, $2.85/W avg), Silfab 440W (American-made FEOC, $2.92/W avg), or REC 460W (premium, $3.11/W avg). FEOC panels required for some lease/PPA structures.
Microinverters (Enphase) cost more than string inverters (SolarEdge) but offer panel-level optimization and better shade handling.
Cash = full price, no credit. Loan = interest adds 15-30% over life. Lease/PPA = $0 down, lower payment with Section 48 savings (until July 2026).
Multiple planes, steep pitch, tile roof, or structural work add $0.10–$0.50/W. Simple south-facing comp shingle roofs are cheapest.
Adding battery backup ($8,500–$12,500) increases total cost but enables demand response income ($225–$300/kW/yr in MA/RI) and backup power.
Projects starting construction before July 4, 2026 can access Section 48 via lease/PPA. After that date, this incentive is gone permanently.
With the federal credit gone, state programs are the primary way to reduce your net cost. These vary significantly — some states save you thousands, others offer almost nothing.
Understanding what you are paying for helps you evaluate whether a quote is fair. Here is how a typical $28,000 (10 kW) system breaks down.
$7,800 of $28,000 system
$3,400 of $28,000 system
$2,800 of $28,000 system
$5,600 of $28,000 system
$3,400 of $28,000 system
$5,000 of $28,000 system
See how many years until your system pays for itself — with $0 federal credit factored in.
Get a personalized quote for your address in 60 seconds. Cash, loan, and lease/PPA options.
Expose hidden costs inside low-APR solar loans before you sign.
State-by-state analysis of solar economics in the post-ITC market.
Why July 4, 2026 matters for solar leases and PPAs.
Cash vs lease comparison after the residential ITC expired.
Get a personalized quote with your real costs, state incentives, and lease/PPA options — including Section 48 access before July 2026.