Loading NuWatt Energy...
We use your location to provide localized solar offers and incentives.
We serve MA, NH, CT, RI, ME, VT, NJ, PA, and TX
Loading NuWatt Energy...
NuWatt designs, installs, and manages solar, battery, heat pump, and EV charger systems across 9 states. One company, one warranty, one point of contact.
Get a Free Quote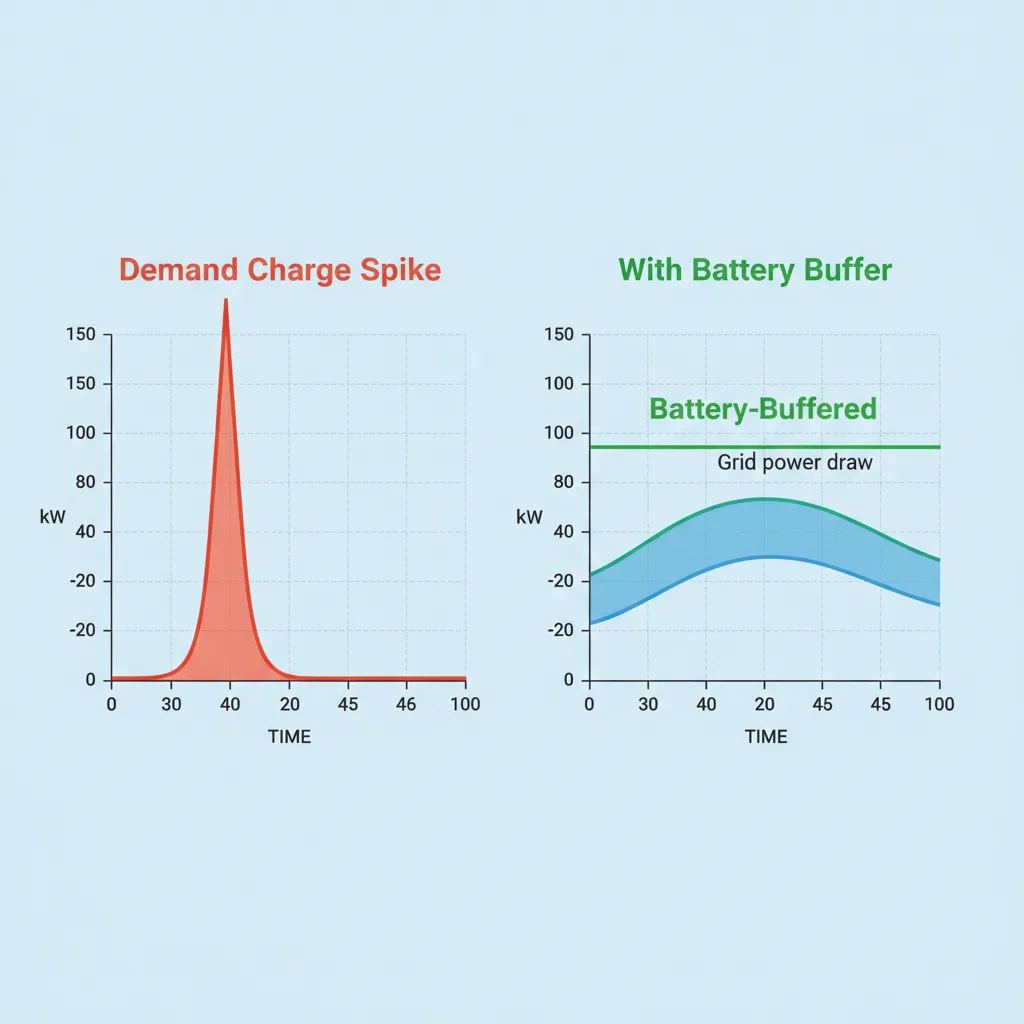
Battery wins for sites with limited service, demand tariffs over $10/kW, or transformer-upgrade delays — transformer wins for high-utilization corridor DCFC.
$150K+
Typical battery path savings
8 mo
Typical battery timeline advantage
~25%
Sites where transformer wins
12
Dimensions compared
Choose battery-buffered DCFC when your site has under 500A service, demand tariffs over $10/kW, or a transformer upgrade quoted above $100K or over 6 months. Choose a transformer upgrade when utilization exceeds 30-50 sessions/day or corridor traffic sustains high power draw.
Every commercial DCFC project in 2026 runs into the same question within the first site visit: does the existing utility service support the peak power, and if not, is it cheaper and faster to upgrade the transformer or to install a battery buffer? The answer is almost never obvious at the door. Service capacity, demand tariff, expected utilization, utility lead time, incentive stack, and the operator's tolerance for O&M all pull in different directions. This guide is the decision framework NuWatt engineers use on feasibility calls — a verdict-led cascade that gets to the right architecture in under twenty minutes.
Two structural points up front. First, these paths are not symmetrical on schedule: a behind-the-meter battery typically clears interconnection in four to eight weeks, while a utility transformer upgrade commonly runs six to eighteen months. Second, the capex comparison is only part of the economic picture — demand charges over the first seven years often swing total cost of ownership by more than the upfront capex gap. The sections that follow walk the full comparison, anchored by a real NuWatt project where battery buffering saved the owner roughly $150,000 of capex and eight months of schedule.
Match your site against these bullets. If three or more Battery bullets apply, start with a battery design. If three or more Transformer bullets apply, start with a utility service upgrade.
| Dimension | Battery-buffered | Transformer upgrade | Winner |
|---|---|---|---|
| Hardware cost (single 150 kW DCFC) | $320K–$420K | $150K–$230K | Transformer |
| Total project cost (incl. utility upgrades) | $320K–$420K | $280K–$550K | Battery |
| Lead time (months) | 3–6 | 9–18 | Battery |
| Demand charge impact | Reduces peak 70%+ | No reduction | Battery |
| Service entrance impact | None | Rebuild likely | Battery |
| Permitting complexity | Battery storage permit + AHJ review | Utility + city + state | Battery |
| O&M complexity | EMS + battery service contract | Standard switchgear service | Transformer |
| Future expansion (add 2nd dispenser) | Add second battery cabinet or oversize at day 1 | Typically already sized for 2× dispensers | Transformer |
| Resilience (V2G / backup) | Inverter + ATS unlocks backup | No inherent backup | Battery |
| Section 30C eligibility | Yes — charger portion | Yes — charger portion only | Tie |
| Section 48E eligibility | Yes — battery (DC-coupled to PV) | No | Battery |
| Site footprint | 150–250 sq ft cabinet | Transformer pad + vault | Tie |
Winner column reflects the typical commercial site profile (200–500A service, 10–30 sessions/day). High-utilization corridor DCFC sites flip several of these rows toward the transformer path.
Modeled on a single 150 kW DCFC dispenser in Eversource CT territory, 15 sessions per day, G-3 demand tariff. Numbers anchored on NuWatt benchmark data 2026.
| Line item | Battery-buffered | Transformer upgrade |
|---|---|---|
| Year 0 capex | $370,000 | $420,000 |
| Utility upgrade fee | $0 | $180,000 |
| Section 30C credit (−30%) | −$60,000 | −$60,000 |
| Section 48E credit (battery only) | −$45,000 | $0 |
| State EVSE rebate (EnergizeCT) | −$100,000 | −$100,000 |
| Net installed (Year 0) | $165,000 | $440,000 |
| Demand charges (7 yrs, $1,600/mo avoided) | $0 | $134,400 |
| O&M battery service (7 yrs) | $21,000 | $0 |
| Battery replacement reserve | $15,000 | $0 |
| 7-year total cost of ownership | $201,000 | $574,400 |
Read the bottom row, not the top. Net installed (Year 0) shows the battery ahead by about $275,000. But the real swing is demand charges — the transformer path carries $134,400 of demand charges over seven years that the battery path avoids. Put together, battery-buffered TCO comes in at roughly one-third of the transformer path at this utilization profile.
Walk them in order. First decisive answer wins.
If YES
Transformer path is usually easier — go transformer.
If NO
Battery path likely preferred — continue.
If YES
Battery path — peak shaving economics dominate.
If NO
Closer call — continue to Q3.
If YES
Transformer — battery cannot recharge fast enough.
If NO
Battery path — utilization favors buffering.
If YES
Battery path — avoid the queue and the capex.
If NO
Either path works; tiebreaker on 48E eligibility and resilience goals.
A Hartford-area multi-bay car wash operator planned two 150 kW DCFC dispensers, four workplace L2 chargers, and a 115 kW solar carport. Eversource CT quoted roughly $180,000 for a transformer upgrade and service-entrance rebuild, with a nine-month interconnection timeline. A 200 kWh / 100 kW battery buffer held grid draw under 30 kW during full sessions, kept the existing 400A service, and unlocked Section 48E coverage on the battery (DC-coupled to the PV). Net effect: the battery path avoided approximately $150,000 of utility-side capex and eight months of calendar, while adding $45,000 of 48E credit value. The project commissioned in nine months instead of seventeen.
See the full CT car wash cost breakdownBattery-buffered DCFC is the default architecture for commercial sites with under 500A service and demand tariffs above $10/kW. Transformer upgrades remain the right call for high-utilization corridor DCFC with grid-scale service already available, and for sites where the utility covers primary-side upgrade costs through make-ready programs.
On the roughly nine commercial EV projects NuWatt Engineering has benchmarked across Connecticut, Massachusetts, and New Jersey in 2025 and 2026, the battery path won roughly 75 percent of the time on total seven-year cost of ownership. The remaining 25 percent were high-utilization corridor sites or fleet depots where sustained draw made peak shaving uneconomic.
Battery depletes mid-session, exposing the site to the full 150 kW grid draw and triggering the demand peak you were trying to avoid. Model the 90th-percentile day before sizing.
Utility transformer quotes often cover only the primary-side transformer. The secondary-side switchgear, conduit, and service-entrance rebuild can add $80,000 to $200,000 — ask for an itemized quote covering both sides of the meter.
Sites that add a small battery alongside a small transformer upgrade often stay on a legacy commercial rate when a TOU or demand-tracking rate would be cheaper. Re-run tariff analysis 90 days post-commissioning.
Choose battery-buffered DCFC when your site has service capacity under 500A, demand tariffs above $10/kW, or a utility transformer upgrade that quotes above $100,000 or takes more than six months. Choose a transformer upgrade when utilization exceeds 30 to 50 DCFC sessions per day, when corridor traffic sustains high power draw all day, or when the utility offers low-cost, fast-turnaround service upgrades.
Primary 30C filing guidance.
Current 48E storage treatment.
Demand charge schedule used in TCO model.
Make-ready and EVSE rebate details.
BESS installed-cost benchmarks.
Industry technical references.
Peak-hour methodology for demand-charge modeling.
LFP degradation and replacement reserve reference.
NuWatt runs a site-specific utilization model, pulls your utility tariff, and returns a battery-vs-transformer recommendation within 72 hours.
Last verified by NuWatt Engineering Team on 2026-04-14. TCO model and cost ranges are illustrative — actual project economics depend on site-specific utilization, utility tariff, and incentive availability at time of install.