A second peak sets the bill
The battery clips an early spike, then lacks energy when a longer or later peak arrives. The utility bills the later maximum and the first discharge has no monthly demand value.

We use your location to provide localized solar offers and incentives.
We serve MA, NH, CT, RI, ME, VT, NJ, PA, and TX
Loading NuWatt Energy...
Use the free estimator for a preliminary layout, or share your preferred response method with the commercial team. Final feasibility still requires site, utility, and engineering review.
Peak shaving is not a fixed savings percentage. It is a month-by-month dispatch problem: lower the facility's billed maximum without running out of power or energy, creating a new charging peak, or missing the later peak that actually sets the bill.
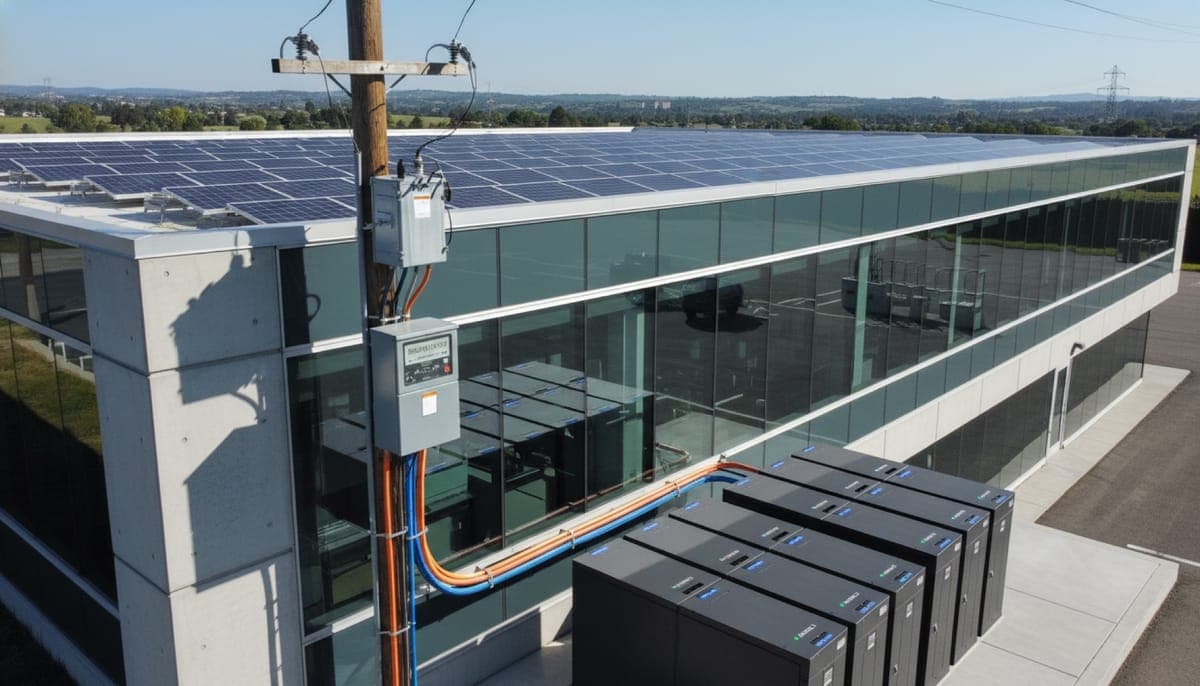
A battery watches facility demand and discharges before grid draw exceeds a control threshold. Monthly savings equal the modeled reduction in billed peak kW multiplied by the exact demand charge on that bill. Battery kW limits how far the peak can fall; usable kWh limits how long the system can hold it. Twelve months of interval data are needed because the highest peak in each billing month—not an average day—sets the value.
The billing equation
Most demand-metered tariffs bill a dollar amount per kW of maximum measured demand during a defined billing window. The useful calculation is therefore monthly, not annual:
(baseline peak kW − modeled peak kW) × $/kW-month
Repeat for every billing month, apply seasonal and ratchet rules, then sum the values. Do not use a state-average electricity rate; energy $/kWh and demand $/kW are different bill components.
Power (kW)
The maximum instantaneous discharge. It caps the vertical distance between the original peak and the controlled threshold.
Usable energy (kWh)
The discharge area available under the peak after usable-state-of-charge and efficiency losses. It caps how long the reduction can be held.
This example is arithmetic, not a sizing recommendation. It uses the same canonical inputs as the public calculator and intentionally omits installed cost.
| Battery configuration | 250 kW / 500 kWh |
|---|---|
| Entered peak-reduction target | 200 kW |
| Entered demand charge | $33.95/kW-month |
| Arithmetic annual demand savings | $81,480 |
| Year-one published program revenue | $50,000 |
| Year-one recurring value | $131,480 |
| Payback | Not shown—no installed quote was supplied |
The fast calculation assumes the target is achieved every month. The feasibility studio replaces that assumption with the uploaded facility load shape and reports each modeled month separately.
The battery clips an early spike, then lacks energy when a longer or later peak arrives. The utility bills the later maximum and the first discharge has no monthly demand value.
An EMS that recharges too aggressively can replace the peak it just removed. A proper dispatch model adds charging load back to the facility trace and respects the tariff window.
Some tariffs bill against prior-month demand, seasonal rules, on-peak windows, or apparent power. A simple kW reduction can overstate value if those mechanics are not represented.
A demand-response dispatch, an outage reserve, and customer peak shaving may compete for the same stored energy. Stacking revenue requires one controls strategy, not three independent spreadsheets.
These are starting points for Massachusetts and Connecticut facilities whose exact bill is not at hand. Each comes from the utility's own tariff summary. Confirm the rate class, billing unit, demand window, and ratchet on the actual account.
| Utility / rate | Applicability | Published total | Source |
|---|---|---|---|
Eversource G-1 Small General Service (Demand Price Option) | Non-residential customers whose demand does not exceed an average of 100 kW over 12 consecutive months, who have elected the demand price option. | $41.65/kW-month | Eversource, 2026 Summary of Eastern Massachusetts Electric Rates for Greater Boston Service Area Effective July 1, 2026 |
Eversource G-2 Medium General Service | Service voltage under 14,000 volts with monthly demand above an average of 100 kW over 12 consecutive months. | $33.95/kW-month | Eversource, 2026 Summary of Eastern Massachusetts Electric Rates for Greater Boston Service Area Effective July 1, 2026 |
Eversource G-3 Large General Service | Service voltage of 14,000 volts or more, where the customer owns the protective devices and transformers. | $30.05/kW-month | Eversource, 2026 Summary of Eastern Massachusetts Electric Rates for Greater Boston Service Area Effective July 1, 2026 |
National Grid G-2 (Medium commercial and industrial) | Massachusetts Electric commercial and industrial customers on the demand-billed medium general service rate. | $15.06/kW-month | National Grid, Massachusetts Electric Company Summary of Electric Delivery Service Rates, M.D.P.U. No. 1-26-C Effective February 1, 2026 |
National Grid G-3 (Large commercial and industrial, time of use) | Massachusetts Electric large commercial and industrial customers billed on peak and off-peak usage. | $10.48/kW-month | National Grid, Massachusetts Electric Company Summary of Electric Delivery Service Rates, M.D.P.U. No. 1-26-C Effective February 1, 2026 |
Eversource Connecticut Rate 30 — Small General Electric Service | Entire electrical requirements at a single service location through one metering installation, where the customer’s maximum demand is less than 200 kW. | $32.31/kW-month | Eversource, Summary of Connecticut Electric Rates Last updated May 1, 2026 |
Eversource Connecticut Rate 35 — Intermediate General Electric Service | Entire electrical requirements at a single service location through one metering installation, where the customer’s maximum demand is less than 200 kW. | $27.27/kW-month | Eversource, Summary of Connecticut Electric Rates Last updated May 1, 2026 |
Eversource Connecticut Rate 37 — Intermediate Time-Of-Day General Electric Service | Entire electrical requirements at a single service location through one metering installation, where the customer’s maximum demand is less than 350 kW. | $19.98/kW-month | Eversource, Summary of Connecticut Electric Rates Last updated May 1, 2026 |
Eversource Connecticut Rate 56 — Intermediate Time-Of-Day Electric Service, Non-Manufacturers | Non-manufacturing customers with an annual maximum demand of at least 350 kW but less than 1,000 kW, at a single service location through one metering installation. | $26.55/kVA-month | Eversource, Summary of Connecticut Electric Rates Last updated May 1, 2026 |
United Illuminating Rate GST — General Service Time-of-Use (demand metered) | Optional for all requirements on a customer’s premises. A demand meter is installed, and the customer must remain on the demand rate, once consumption exceeds 1,560 kWh in a single monthly billing cycle. | $12.96/kW-month | The United Illuminating Company, General Service Time-of-Use Rate GST, C.P.U.C.A. No. 2508 (Docket No. 26-01-02) Effective July 1, 2026 |
Tariff references verified August 3, 2026.
Massachusetts National Grid publishes $200 per enrolled kW for its business Daily Dispatch offering. Connecticut Energy Storage Solutions publishes $325/kW for small and medium C&I in years one through five, stepping to $175/kW in years six through ten. The battery must still preserve enough energy to meet both the program event and the facility peak.
MA source facts verified August 3, 2026; CT source facts verified August 3, 2026.
Overlay interval solar production on the facility load before claiming demand savings. Solar can lower a midday plateau and recharge a battery, but it cannot reach an evening peak by itself. A combined controls model should schedule solar charging, peak shaving, outage reserve, and program dispatch together.
There is no defensible universal percentage. Reduction depends on the shape and duration of the facility peak, battery kW, usable kWh, charging strategy, tariff ratchets, and whether a later peak occurs after the battery discharges. Model at least twelve months of interval data against the exact billed demand rate.
Upload interval data in the public studio, review the result before sharing an email, and save a private decision report only when it is useful.