Loading NuWatt Energy...

We use your location to provide localized solar offers and incentives.
We serve MA, NH, CT, RI, ME, VT, NJ, PA, and TX
Loading NuWatt Energy...
NuWatt designs, installs, and manages solar, battery, heat pump, and EV charger systems across 9 states. One company, one warranty, one point of contact.
Get a Free QuoteWho pays for the transformer, feeder, or substation upgrade when your 200 kW to 5 MW commercial solar project hits a constrained distribution circuit? Complete guide to Pre-Application Reports, cost-causation allocation, Group Study triggers, and mitigation strategies post-DPU 25-48.
PAR Cost
$300-$1.5K
Before full application
Transformer Upgrade
$25K-$100K
Typical range
Feeder Reconductor
$50K-$500K+
Often Group Study
Substation Upgrade
$500K-$5M+
Always shared
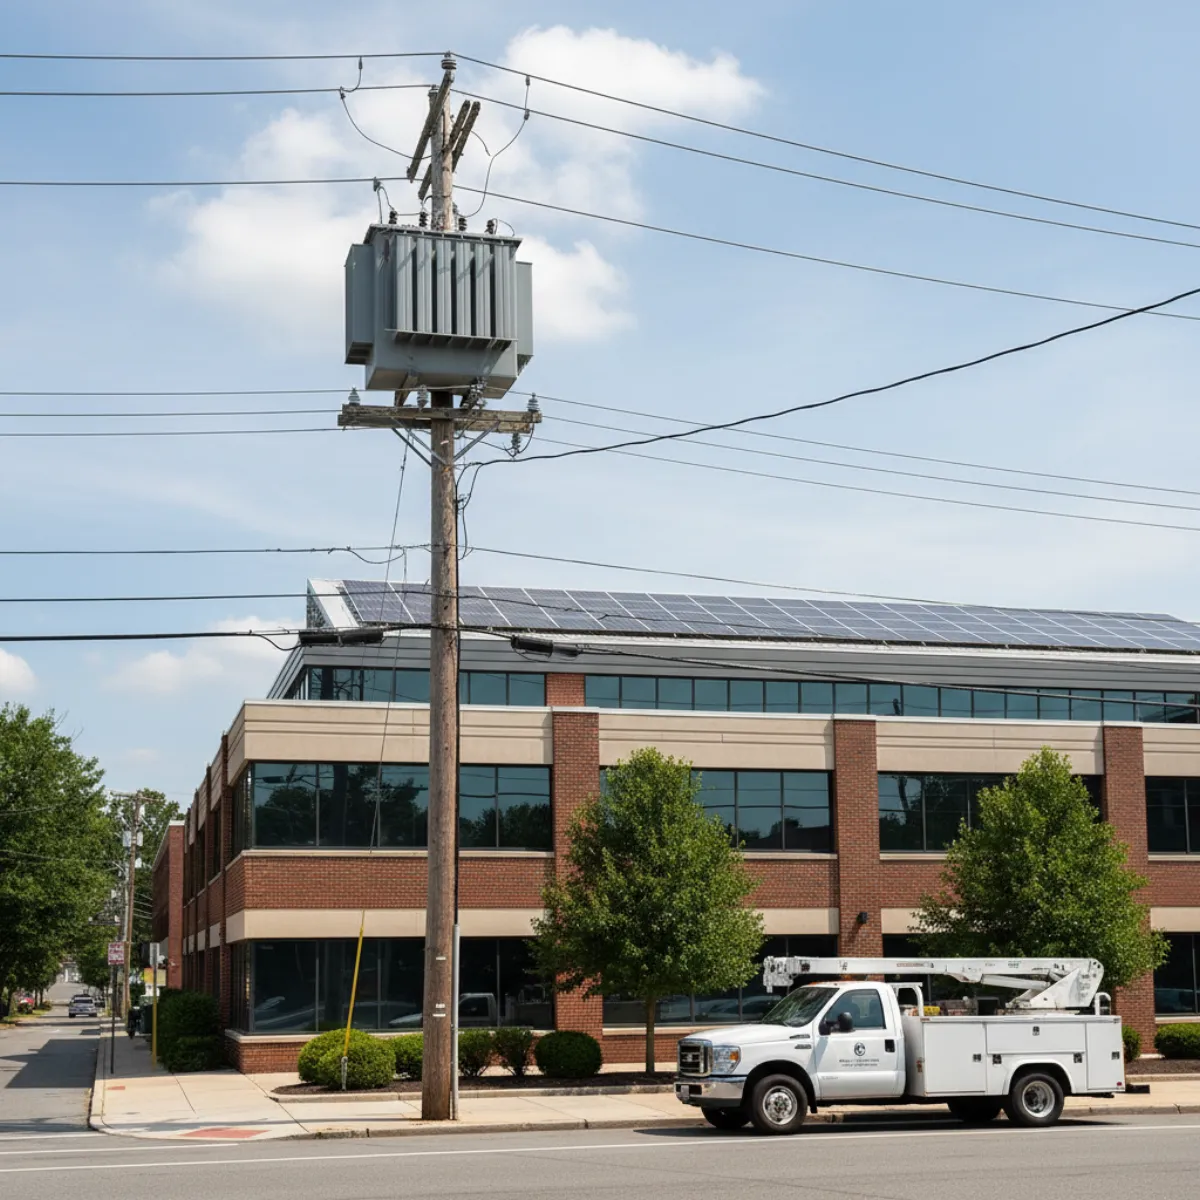
Under the MA DPU interconnection tariff, cost-causation governs: if your project alone causes the need for an upgrade, you pay for it (you break it, you buy it). Typical single-project upgrade costs include transformer replacement ($25K-$100K) and service upgrades ($15K-$75K). When multiple queued projects share responsibility for the same constraint — most common on feeder reconductors ($50K-$500K+) and substation bank upgrades ($500K-$5M+) — the utility triggers a Group Study and allocates costs pro-rata by nameplate AC capacity. Always order a Pre-Application Report ($300-$1,500) before full engineering — it reveals approximate upgrade costs and queue position in 10-25 business days.
For commercial solar projects between roughly 200 kW and 5 MW in Massachusetts, the single most common cause of a dead deal is not permitting, not financing, and not the federal tax landscape. It is an unexpected interconnection upgrade cost allocation. A site owner signs a lease, the developer invests in engineering, and then the utility interconnection study returns a $350,000 feeder reconductor allocation that destroys the project IRR.
The rules governing who pays are not secret. The MA DPU-approved tariffs set out clear cost-causation principles. But the specific application of those rules — which feeder has constrained capacity, whether your project will trigger a Group Study, what the pro-rata allocation will look like — is site-specific and cannot be known with certainty until you ask the utility through a Pre-Application Report (PAR) or a full interconnection study.
This guide exists because the two adjacent NuWatt resources — the DPU 25-48 reform page (policy-focused) and the 2026 interconnection queue page (queue general) — address the surrounding landscape but not the specific cost-allocation mechanics developers and site hosts have to understand before signing an engagement. Here we focus narrowly on: who pays, how much, when it gets shared, and how to mitigate.
The audience for this page is MA commercial developers in the 100 kW to 5 MW scale, site-host decision-makers evaluating a proposed project on their building or land, and consultants performing interconnection feasibility diligence. If you are a residential-scale customer, the dynamics here mostly do not apply — residential systems almost always qualify for Simplified review with no meaningful upgrade allocation risk.
Every MA commercial solar interconnection application lands in one of four review tiers. The tier determines the timeline, the study cost, and the likelihood of a material upgrade allocation. Here is the decision tree every developer should walk through before committing engineering dollars.
Under 15 kW (single-phase) / under 25 kW (three-phase)
Fastest lane. Projects qualify if they pass 10 technical screens covering aggregate DG on the feeder, transformer loading, equivalent impedance, and voltage regulation. Residential and very small commercial only — not a realistic path for the 200 kW to 5 MW commercial projects covered in this guide, but included here for completeness.
Application Cost
No app fee or under $100
Study Required
None
Cost-Causation Exposure
Very rare — hosting capacity almost always available
25 kW to 1 MW (Eversource) / 25-300 kW (National Grid, typical)
The typical path for mid-size commercial rooftop and canopy projects. Utility applies additional screens beyond Simplified review — aggregate penetration limits, voltage flicker, protection coordination. If any screen fails, the project is kicked to Standard review with a full impact study. Cost-causation allocation almost always applies at this tier if upgrades are required.
Application Cost
$500-$3,000 application + supplemental screening fees
Study Required
Supplemental screens only (no full impact study)
Cost-Causation Exposure
Moderate — localized transformer or service upgrades possible
> 1 MW (Eversource) / > 300 kW (National Grid, typical)
Full engineering review — load flow analysis, short circuit analysis, protection coordination study, voltage regulation study. The utility quantifies exactly what distribution system upgrades are required and provides a cost estimate. Cost-causation rules assign these costs to the interconnecting customer under the MA tariff. This is where the majority of project-killing cost surprises originate.
Application Cost
$3,000-$50,000+ for studies
Study Required
Impact Study + Detailed Study (CESIR equivalent)
Cost-Causation Exposure
High — feeder, substation, and transformer upgrades common
Multiple projects sharing system impact on the same feeder or substation
Triggered when the utility determines that multiple queued projects cause overlapping impacts on the same distribution assets. Instead of evaluating each project in isolation, the utility studies them as a cohort and allocates upgrade costs pro-rata by nameplate capacity. Timeline is longer because all projects in the group must complete agreements before any proceed, but per-project cost is typically lower than Standard review alone.
Application Cost
Pro-rata share of joint study costs
Study Required
Cluster / Group Impact Study
Cost-Causation Exposure
Shared — pro-rata by nameplate capacity
A project that lands in Standard review will often see 5-10x the upgrade allocation risk of the same project in Expedited review. Dropping a tier is one of the highest-leverage design decisions. Two proven methods: shave nameplate below the threshold (typical loss: 1-4% of revenue), or pair with storage and contractually cap export to stay below the threshold. For our full queue and tier guidance, see Solar Interconnection Queue 2026.
The Pre-Application Report is a formal utility document that returns approximate upgrade cost ranges, feeder hosting capacity, and queue position for your proposed project — before you submit a full interconnection application. It is the single highest-value pre-development spend on a MA commercial solar project.
A PAR costs $300-$1,500 and takes 10-25 business days. Compare that to what it protects against.
Without PAR — worst case
$40K-$80K
Engineering sunk cost on a site that returns an unaffordable Standard-review upgrade allocation
Without PAR — timeline risk
3-9 months
Discovering upgrade cost late in the process pushes the project past the Section 48E placed-in-service cutoff (Dec 31, 2027 for late starts) and SMART capacity block closures
PAR investment
$300-$1,500
One-time per site, per utility request
Effective hit rate
~1 in 4
Share of commercial sites where PAR reveals a cost scenario significant enough to redesign or walk away
Bottom line: for any commercial site above 100 kW, the PAR is effectively mandatory pre-development hygiene. Skipping it is a false economy.
Massachusetts follows two parallel allocation principles. Single-project impacts follow cost-causation. Multi-project shared impacts follow pro-rata cost-sharing in a Group Study. Knowing which rule applies to your project is the difference between a $400,000 bill and a $80,000 bill for the same physical upgrade.
When a single project causes the need for a distribution system upgrade, MA tariffs allocate the full upgrade cost to that project. Examples where cost-causation almost always applies:
Example: A 450 kW rooftop project on a 300 kVA service transformer requires a transformer upgrade to 500 kVA. Cost: $45,000. Allocated 100% to the interconnecting customer. No other queued project contributes to the need, so cost-sharing does not apply.
When multiple queued projects share responsibility for the same upgrade, the utility groups them into a cluster study and allocates upgrade costs pro-rata by nameplate AC capacity. Examples where cost-sharing typically applies:
Allocation formula:
A rural Eversource feeder in Hampshire County has 2.5 MW of remaining hosting capacity. Four queued projects collectively propose 4.8 MW, triggering a feeder reconductor estimated at $420,000. The utility forms a Group Study.
| Project | Nameplate | Share | Allocation |
|---|---|---|---|
| Project A (ground-mount) | 2,000 kW | 41.7% | $175,000 |
| Project B (carport + rooftop) | 1,200 kW | 25.0% | $105,000 |
| Project C (rooftop) | 950 kW | 19.8% | $83,100 |
| Project D (ground-mount) | 650 kW | 13.5% | $56,900 |
| Total | 4,800 kW | 100% | $420,000 |
Without Group Study, whichever project applied first and was studied in isolation would have received the full $420,000 allocation and almost certainly been killed. Cost-sharing brings per-project allocation down to 13-42% of the total, preserving project viability across the cohort.
These are the upgrade categories MA utilities most commonly allocate to commercial solar interconnection customers. Ranges reflect observed cost bands across Eversource, National Grid, and Unitil projects. Actual cost on your project is site-specific and should always be confirmed via PAR or full study.
Project nameplate exceeds transformer rating (plus reverse-power headroom)
Small pole-top or pad-mount transformers are often replaced when a single commercial project exceeds the service rating. Costs scale with kVA rating and whether overhead or underground. Customer-caused upgrade — allocated entirely to the interconnecting project.
Secondary conductors undersized for bi-directional flow
Secondary wire, service entrance, and metering equipment upgrades. Common on older commercial buildings where the existing service was sized for load only, not export. Usually customer-caused.
Feeder thermal or voltage limit exceeded by project or aggregate queue
Replacing existing primary conductors with larger wire to increase thermal capacity, or rebuilding sections to address voltage regulation. Cost varies dramatically with feeder length, terrain, and road work requirements. Frequent Group Study candidate when multiple queued projects share the feeder.
Project requires three-phase service on a single-phase tap
Rural MA sites frequently sit on single-phase primary taps that cannot support commercial-scale three-phase solar. Extending three-phase requires new conductor, additional phase wires on existing poles, and additional transformers. Almost always customer-caused.
Voltage regulation falls outside ANSI C84.1 limits under PV export
High PV penetration on long rural feeders can push voltage above 1.05 pu at the end of line. The utility may install a new line voltage regulator or upgrade existing LTC controls. Often a Group Study cost when multiple projects contribute.
Existing protection cannot coordinate with inverter fault current
Direct Transfer Trip (DTT) schemes, recloser upgrades, and relay setting changes to handle reverse power flow and anti-islanding coordination. Can be customer-caused or Group-allocated depending on which projects trigger the need.
Aggregate DG exceeds substation bank reverse-power rating
The largest cost category — replacing or modifying a substation transformer bank or installing a new load-tap-changer. Almost always a Group Study allocation since one project rarely causes this alone. These costs can kill projects unless cost-sharing brings the per-project burden down to viability.
All three MA investor-owned utilities operate under the same DPU-approved tariff framework, but procedural details differ — review thresholds, PAR timelines, Group Study formation rules, and security deposit requirements. Here is what each utility does differently.
Largest MA utility; most active DG queue; publishes hosting capacity map
PAR Cost
$300 (simple) - $1,500 (complex site)
PAR Timeline
10-20 business days
Allocation Formula
Cost-causation default for Expedited review. Group Study allocates pro-rata by nameplate AC capacity among all projects whose individual impact contributes to the need for the upgrade.
Notable Rules
Common Friction Points
Second-largest territory; Group Study process well-developed
PAR Cost
$300 (simple) - $1,500 (complex site)
PAR Timeline
15-25 business days
Allocation Formula
Cost-causation default. For Group Study, National Grid uses a pro-rata share based on each project nameplate divided by the cumulative nameplate of all projects contributing to the constraint. Order-of-queue is not the allocation driver — shared impact is.
Notable Rules
Common Friction Points
Smallest MA IOU; Fitchburg-area service territory
PAR Cost
$300 (simple) - $1,000
PAR Timeline
10-20 business days
Allocation Formula
Follows DPU-approved standard tariff structure. Cost-causation for individual project impacts; Group Study pro-rata for shared impacts. Smaller queue means Group Studies are less common but the feeders and substations are also smaller, so upgrades can be triggered sooner.
Notable Rules
Common Friction Points
Connecticut commercial interconnection runs through PURA and a separate state tariff. Massachusetts is governed by a distinct stack of authorities, and understanding which body owns which decision tells a developer where to push when a cost allocation looks wrong. Three layers shape every MA commercial interconnection.
Distributed generation interconnection in Massachusetts is governed by the Department of Public Utilities (DPU) interconnection tariff that Eversource, National Grid, and Unitil each operate under. It is the DPU tariff — not a federal rule and not the utility's own discretion — that sets the review tiers, the cost-causation principle, and the Group Study framework described on this page. When a cost-causation allocation looks inconsistent with how the tariff reads, the dispute resolution path runs through the DPU, not the utility's internal appeals desk. This is the single biggest procedural difference from the CT process, which sits under PURA.
Massachusetts sits inside the ISO-New England (ISO-NE) control area. For the 200 kW to 5 MW commercial projects this guide covers, interconnection is overwhelmingly a distribution-level matter handled by the utility under the DPU tariff — the costs on this page (transformers, feeders, substation banks) are distribution assets. The ISO-NE layer becomes relevant only when aggregate distributed generation on a substation begins to affect the bulk transmission system, which can pull in an additional regional study step on the largest clustered projects. Knowing the dividing line keeps developers from over-scoping the study expectation for a typical rooftop or carport project: most MA commercial solar never touches the ISO-NE process at all.
Practical signal: if a PAR or impact study references transmission-level or sub-transmission impacts rather than a single feeder or distribution substation, the project has crossed from a purely distribution interconnection into territory where the ISO-NE regional layer can add time and cost. That is rare below ~5 MW but worth flagging early.
Massachusetts is unique among NuWatt's states in pairing this interconnection process with the SMART (Solar Massachusetts Renewable Target) incentive, now in its 3.0 capacity-block structure. SMART incentive values step down as capacity blocks fill within each utility's service territory, so interconnection delay is not just a federal-tax-timing risk (the §48E placed-in-service window) — it is also a SMART-block risk. A project that loses six months in a Group Study can land in a lower-value SMART block than the one it was underwritten against. This coupling of interconnection timeline to a declining state-incentive schedule is specific to MA; CT's NRES tariff and the other NuWatt states do not work the same way. It is a third reason, beyond cost allocation and the federal ITC, that front-loading the PAR matters in Massachusetts.
Group Study and cost-sharing are not automatic. The utility decides based on specific triggering conditions. Developers and site hosts should understand these conditions because a project that would have been killed under Standard review may be viable under Group Study — but you have to know to ask for it.
When multiple applications land on the same distribution feeder within a short time window, the utility typically studies them together rather than sequentially. This is the most common Group Study trigger.
If total queued DG on a feeder exceeds the utility-published hosting capacity, any upgrade required to accept the cohort is allocated pro-rata across contributing projects.
Substation bank and LTC upgrades almost always trigger Group Study because one project rarely causes these alone. Allocation can span dozens of projects across multiple feeders served by the substation.
Occasionally the utility proactively proposes a feeder or substation upgrade to serve multiple anticipated projects. Queued projects benefiting from the upgrade are allocated a pro-rata share.
Rural clusters requiring three-phase extension down a single-phase road section are classic Group Study candidates. Each project on the extended section pays its share.
When multiple PV projects collectively push a feeder above voltage regulation limits, a new line regulator or capacitor bank is allocated pro-rata across contributors.
Group Study is almost always better for the individual developer than Standard review when upgrade costs are large. The trade-off is timeline — Group Studies take 6-18 months versus 3-9 months for Standard — but the cost savings typically far outweigh the delay. When PAR results show significant upgrades, ask the utility directly whether Group Study treatment is available.
Once you know the rules, you can manage the risk. These are the seven mitigation strategies that professional MA commercial developers actually use to keep projects viable when interconnection costs threaten the economics.
The single most important step. For $300-$1,500 and 10-25 business days, the utility returns approximate upgrade cost estimates, available hosting capacity on your feeder, and queue position data. This converts an unknown risk into a priced question before you invest in full engineering.
Cost
$300-$1,500
Upside
2-6 months of wrong-path engineering
Dropping from 1.05 MW to 999 kW keeps the project in Expedited review instead of Standard. Dropping from 26 kW to 24 kW (single-phase) preserves Simplified treatment. The revenue loss from slight undersizing is usually far smaller than the cost of a Standard-tier impact study plus a full upgrade allocation.
Cost
Minor revenue reduction (~1-4%)
Upside
3-9 months and $50K-$500K in upgrades
Pair solar with battery storage and use the inverter export limit to keep grid export below the problem threshold. Many utilities accept a contractual export cap (verified by certified controls) as the nameplate for interconnection purposes. Nameplate PV can be much larger than the export cap, preserving most energy revenue while avoiding upgrades.
Cost
Battery adds $300-$500/kWh capex
Upside
Often the only way to keep a feeder-constrained site viable
Before signing a site lease, review the utility hosting capacity map for the specific feeder serving the parcel. Green-zone feeders with high remaining hosting capacity will cost a fraction of what red-zone constrained feeders cost. This is the cheapest mitigation — choosing the right site in the first place.
Cost
Free
Upside
Entire project risk
If your project triggers an upgrade on a constrained feeder, check whether other queued projects share the problem. Opting into a Group Study can reduce your pro-rata share of upgrade costs from 100% to 10-40% depending on how many projects share the constraint. Trade-off: longer timeline.
Cost
Pro-rata share of joint study fees
Upside
Can convert a dead project into a viable one
Most utilities refund the study deposit if you withdraw before the Impact Study is initiated. If the PAR reveals upgrade costs that kill the economics, withdraw early rather than sinking more capital. Then reassess — smaller nameplate, storage pairing, or a different site.
Cost
Forfeited PAR fee only
Upside
Preserves deposit capital for the next attempt
Projects later in the queue inherit upgrade obligations from earlier projects if the earlier projects caused the need. But projects earlier in the queue can be stuck funding an upgrade that benefits later projects. Timing your application to land either clearly before or clearly after a queue cluster can shift cost burden dramatically.
Cost
Time opportunity cost
Upside
Variable — can save or cost months
DPU Order 25-48, issued in 2025, implemented several procedural reforms that affect commercial interconnection cost allocation. The underlying cost-causation tariff did not change, but the process around it did. Here is what is different in 2026.
Utilities now operate under DPU-mandated PAR turnaround targets, typically 10-25 business days depending on complexity. Previously PARs could take 30-60 days with no accountability. For commercial developers, this compresses the front-end due diligence window meaningfully.
Each IOU now publishes a standardized queue dashboard showing project count, aggregate queued capacity by feeder, and cluster formation status. Developers can see in real time whether their project will likely land in a Group Study cohort before even submitting a PAR.
Group Study cohorts now form at defined queue milestones with clear criteria, reducing the ad-hoc nature of prior cluster determinations. Developers have better visibility into whether their project will be studied individually or as part of a group.
The reforms expressly recognize storage-paired configurations with contractual export caps as a distinct interconnection pathway. Utilities must evaluate the system based on maximum export rather than PV nameplate, opening the storage-cap mitigation strategy more broadly.
Security deposit refund conditions were clarified, making it easier to withdraw strategically when PAR reveals unaffordable allocations without forfeiting study deposits.
For the full policy and procedural detail on DPU 25-48 reforms, see our dedicated DPU 25-48 Reform page.
Interconnection upgrade costs paid by the customer are generally eligible to be included in the basis of the solar energy property for federal tax credit purposes. This materially softens the after-tax impact of upgrade allocations — but only if you understand which federal provisions still apply.
Commercial solar projects that began construction by July 4, 2026 locked in the full Section 48/48E ITC timing pathway; projects that start later still qualify if placed in service by December 31, 2027. Interconnection costs paid by the taxpayer and required to place the system in service are generally includible in the tax basis, meaning a $200,000 interconnection upgrade can generate $60,000+ in ITC value (at 30% rate) plus MACRS depreciation benefits. Confirm with your tax advisor whether specific upgrade categories qualify for your project.
Tax-exempt entities (municipalities, non-profits, cooperatives) can elect direct pay for the Section 48/48E ITC under Section 6417. For these project types, interconnection upgrade costs are recovered via the direct payment mechanism when included in the qualifying project basis.
The ITC (including the portion generated by interconnection upgrade basis) is transferable under Section 6418. Project owners without sufficient tax appetite can sell the credit, effectively monetizing the tax value of interconnection upgrade allocations. Typical market discount is 8-12% from face value.
Why timing matters
Commencing construction by July 4, 2026 locked in the full Section 48/48E ITC timing (placed in service through roughly 2030). Projects that begin construction after that date still qualify but generally must be placed in service by December 31, 2027. Interconnection delays (especially Group Study timelines of 12-18 months) can push a late-starting project past that placed-in-service cutoff. Front-load PAR and interconnection application timing to stay ahead of the December 31, 2027 placed-in-service cutoff.
Full policy detail on the 2025 DPU order reshaping MA interconnection procedures, queue transparency, and storage pathways.
Read guideGeneral guide to the MA interconnection queue — application process, timelines, and queue management strategy.
Read guideMunicipal building permits, electrical permits, fire code review, and zoning approvals for MA commercial solar.
Read guideEnd-to-end project timeline from site selection to PTO, including interconnection and permitting phases.
Read guideNet metering rules, credit valuation, and allocation mechanics for commercial-scale MA solar.
Read guideRecent net metering threshold changes and impact on small-commercial interconnection pathways.
Read guideMaster hub page for MA commercial solar — SMART 3.0, federal incentives, pricing, and development.
Read guideWhen primary metering applies, cost implications, and interconnection configuration for larger commercial projects.
Read guideA Pre-Application Report (PAR) is a formal utility study that, for a fee of $300-$1,500, tells you approximately what distribution system upgrades will be required for your proposed commercial solar project — before you submit a full interconnection application. The PAR reveals hosting capacity on your feeder, typical upgrade cost ranges, queue position, and whether a Group Study might apply. For a project in the 200 kW to 5 MW range, the PAR is one of the single highest-value pre-development expenses you can make. It converts an unknown multi-hundred-thousand-dollar risk into a priced question. NuWatt orders a PAR on every commercial project before completing engineering because the results often drive design decisions around nameplate sizing, storage pairing, and whether the site is even viable.
NuWatt runs Pre-Application Reports, Group Study analysis, and storage-cap feasibility on every MA commercial project. Know your real interconnection cost envelope before signing engineering contracts or site agreements.