Loading NuWatt Energy...

We use your location to provide localized solar offers and incentives.
We serve MA, NH, CT, RI, ME, VT, NJ, PA, and TX
Loading NuWatt Energy...
Use the free estimator for a preliminary layout, or share your preferred response method with the commercial team. Final feasibility still requires site, utility, and engineering review.
The IPMVP framework, revenue-grade metering specs, P50/P90/P99 production thresholds, and performance-guarantee structures that Massachusetts lenders, PPA investors, and Section 6418 tax-credit buyers now expect on every commercial array 250 kW and up.
IPMVP Options
A / B / C / D
Most use Option C or D
Meter Accuracy
Class 0.2
ANSI C12.20 standard
Lender Threshold
P90
For DSCR sizing
Typical Guarantee
95%
Of expected kWh
Measurement and verification (M&V) is the engineering discipline of proving that a solar array delivered the kilowatt-hours it was contracted to deliver. For Massachusetts commercial solar projects 250 kW and up, M&V is effectively required by lenders, PPA offtakers, tax-equity investors, and Section 6418 tax-credit transfer buyers. The framework is the International Performance Measurement and Verification Protocol (IPMVP), with Option C (whole-facility metering) and Option D (calibrated PVsyst or SAM simulation) being the two options used on almost all commercial arrays. A compliant M&V plan specifies ANSI C12.20 Class 0.2 revenue-grade metering, 15-minute interval data, weather normalization using onsite or satellite irradiance, and reporting cadence keyed to each stakeholder — monthly for lenders, quarterly for PPA offtakers, annual PE-stamped reports for tax-credit buyers.
A 500 kW rooftop array in Worcester is not just an energy asset. It is a 25-year stream of contracted cash flows that a lender has underwritten, a PPA offtaker has committed to purchase, and a Section 6418 tax-credit buyer may have paid cash for at 92 cents on the dollar. Each of those stakeholders needs independent, defensible evidence that the array is producing what it was supposed to produce — not next year, not at the end of the warranty period, but every month on an ongoing basis. That evidence is the job of measurement and verification.
Measurement and verification sits adjacent to operations and maintenance but solves a different problem. O&M keeps the asset running. M&V proves the asset ran, translates raw meter data into contractually meaningful metrics (performance ratio, weather-adjusted kWh, availability percentage), and produces the reports that underpin debt service, PPA billing, SMART reconciliation, and tax-credit recapture defense. A project with excellent O&M but no M&V plan is a project that cannot enforce a performance guarantee or defend a Section 48E investment tax credit against an IRS examination.
For Massachusetts commercial solar at 250 kW and up, the Section 6418 transferability market has made rigorous M&V non-optional. Credit buyers, who may be insurance companies, corporate treasuries, or family offices with no energy expertise, rely on PE-stamped annual reports to confirm that the array remained in service and continued producing at or near expected levels. The marketplace has already priced M&V quality into transfer discount rates — projects with weak or missing M&V documentation trade at 3-5 cents per dollar below projects with institutional-grade reports. On a 2 MW array generating roughly $600,000 in transferable credits, that is up to $30,000 of preventable value leakage.
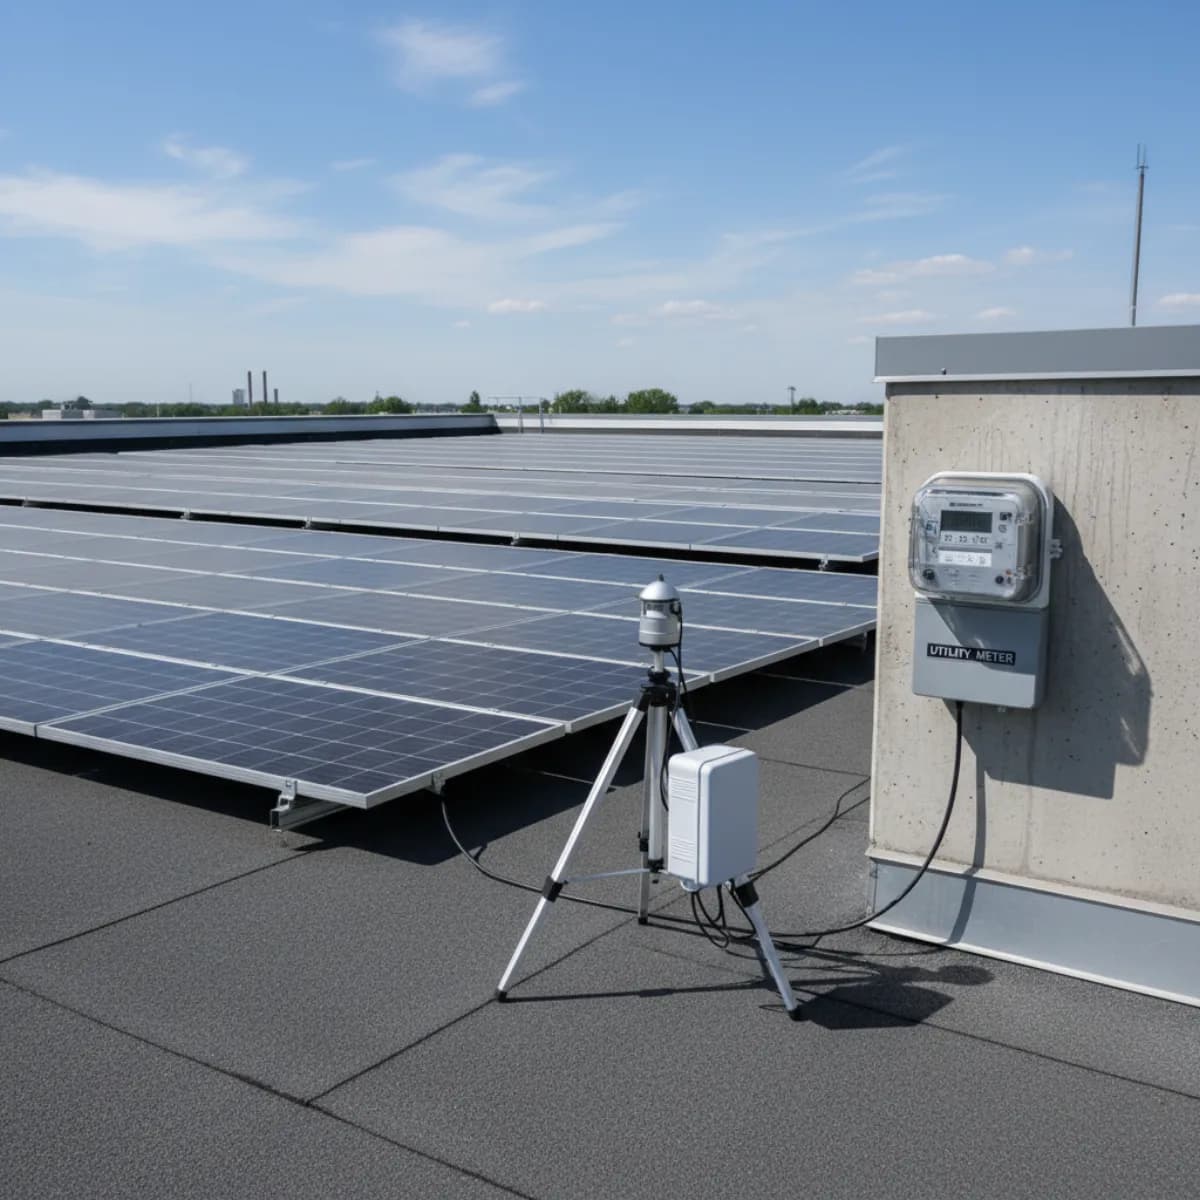
Revenue-grade ANSI C12.20 Class 0.2 metering paired with onsite pyranometer — the foundation of a defensible M&V plan for lender-financed Massachusetts commercial solar.
The International Performance Measurement and Verification Protocol defines four options for structuring an M&V plan. Each option specifies how much is measured directly versus estimated from engineering models. For Massachusetts commercial solar, Option C (whole-facility metering) and Option D (calibrated simulation) dominate the market — but the choice between them has material implications for reporting complexity, sensor requirements, and lender acceptance.
IPMVP Option A
Approach
Measure only the key performance parameters that drive savings, and estimate the rest from engineering calculations, manufacturer data, or short-term spot measurements. Parameters not measured must be documented with assumed values and uncertainty estimates.
Fit for Commercial Solar
Rarely used for commercial solar because the entire energy system is the measured asset. Occasionally used for small behind-the-meter arrays where irradiance and panel temperature are measured and inverter efficiency is assumed from manufacturer curves.
Verdict
Generally not accepted by institutional lenders or tax-credit transfer buyers. Insufficient rigor for performance guarantee enforcement.
IPMVP Option B
Approach
All parameters required to calculate savings or production are continuously measured. For solar, this means revenue-grade kWh metering plus onsite irradiance, ambient temperature, and module temperature sensors feeding into a performance ratio (PR) calculation.
Fit for Commercial Solar
Used for standalone PV arrays where the output is being measured against modeled expectations at short intervals. Requires a calibrated pyranometer (Class A or Secondary Standard per ISO 9060) and data acquisition that records at 1-15 minute intervals.
Verdict
Acceptable for many lenders when the array is separately metered. Preferred by performance engineers because it provides the cleanest data for fault diagnosis, not just revenue verification.
IPMVP Option C
Approach
Measure energy at the utility meter level (or equivalent facility boundary) and compare against a baseline model. For solar, a net generation meter plus a gross production meter capture the delivered kWh. Typical IPMVP Option C with a single-variable regression against irradiance or weather data.
Fit for Commercial Solar
The most common option for commercial PPA and lender-financed arrays. Works well because the revenue-grade production meter is already required for SMART and utility interconnection, and satellite irradiance data can be used as the independent variable.
Verdict
Default choice for most Massachusetts commercial solar projects 250 kW and up. Aligns with how PPA rates, SMART payments, and net metering credits are all calculated off the same meter.
IPMVP Option D
Approach
A calibrated hourly or sub-hourly simulation model (PVsyst, SAM, Helioscope) serves as the baseline. The model is calibrated against at least 9-12 months of measured production data until the monthly mean bias error (MBE) is within acceptable limits — typically plus or minus 5%.
Fit for Commercial Solar
Required when measured irradiance data is unreliable, when there are long data gaps, or when the PPA explicitly specifies an expected kWh profile generated from a calibrated model. Also used when the baseline year would otherwise be unrepresentative due to weather anomalies.
Verdict
Strong choice for §6418 tax-credit transfer deals where the buyer wants production verified against a technical model rather than only against weather. Requires higher upfront engineering effort but produces defensible annual reports.
| Option | Measurement Scope | Sensor Requirements | Lender Acceptance |
|---|---|---|---|
| A | Key parameters only | Minimal — spot measurements | Rarely Accepted |
| B | All parameters measured | Revenue meter + POA pyranometer + temp sensors | Accepted |
| C | Whole facility at utility meter | Revenue meter + weather regression (satellite OK) | Standard Choice |
| D | Calibrated simulation baseline | Revenue meter + PVsyst/SAM/Helioscope model | Tax Credit Favorite |
Every defensible M&V report answers one question: how did the array perform relative to what the sun actually delivered? That requires converting raw measured kilowatt-hours into a weather-adjusted figure that can be compared against expected production on a like-for-like basis. Three related calculations sit at the core of every commercial solar M&V workflow.
The most widely used normalization metric. PR compares actual AC energy output to the theoretical maximum energy the array could have produced at the measured plane-of-array (POA) irradiance if there were no losses.
A typical Massachusetts rooftop PV array delivers a PR of 0.78-0.85 in year one, declining by about 0.005-0.01 per year due to module degradation. A PR below 0.75 on a system that should be hitting 0.82 signals a real performance issue — not a weather-related shortfall.
When Option C (whole-facility) is in use, expected production is scaled by the ratio of actual measurement-period irradiance to TMY (typical meteorological year) irradiance. This is the calculation used in most PPA true-ups.
Example: a 500 kW MA array with a TMY expected annual production of 625,000 kWh, during a year when measured POA irradiance is 95% of the TMY reference, has weather-adjusted expected production of 593,750 kWh. If the meter records 580,000 kWh, the shortfall is 13,750 kWh (2.3%) — well within normal tolerances and not a guarantee breach.
A simple benchmarking metric used across projects. Specific yield normalizes for array size and allows comparison of a 100 kW rooftop array in Boston to a 2 MW ground-mount array in Pittsfield.
Typical Massachusetts commercial arrays deliver 1,150-1,350 kWh/kWp per year depending on tilt, orientation, shading, and climate zone. Eastern MA rooftop arrays with 10-15 degree tilts tend to cluster around 1,200-1,250 kWh/kWp. Ground-mount arrays with optimal tilt can reach 1,300-1,400 kWh/kWp.
The cleanest PR calculation uses an onsite POA pyranometer because it measures the exact irradiance that reached the modules — after accounting for tilt, orientation, and any nearby shading. Satellite data (from Clean Power Research SolarAnywhere, Solcast, or Solargis) is usually horizontal global irradiance that must be transposed to the module plane, introducing 2-5% additional uncertainty. Best practice on arrays at 500 kW and up is a hybrid: onsite Class A pyranometer as the primary source, satellite data as backup for sensor outages and as a cross-check against pyranometer drift.
Every solar production forecast is a probability distribution, not a single number. A PVsyst or SAM simulation outputs a mean expected production along with uncertainty bounds driven by weather variability, model accuracy, and equipment tolerances. Lenders, tax-equity investors, and performance guarantee drafters all care about different percentiles of that distribution.
50% probability of exceeding
What It Means
The expected, or median, annual production. In a typical year, half of all outcomes will exceed P50 and half will fall below. Used for marketing economics, internal IRR calculations, and owner-level pro formas.
How Lenders Use It
Not accepted as the basis for debt service coverage ratio (DSCR) calculations. Too aggressive for underwriting because it implies a 50% chance of shortfall in any given year.
Massachusetts Example
A 500 kW Massachusetts rooftop array with a P50 of 625,000 kWh/year would be advertised as producing roughly 1,250 kWh/kW annually.
90% probability of exceeding
What It Means
The production level that will be exceeded in 9 out of 10 years. Accounts for weather variability, typical equipment issues, and normal operating disruptions. Usually 8-12% below P50 for Massachusetts commercial arrays.
How Lenders Use It
The standard debt-sizing threshold for non-recourse project finance. DSCR calculations use P90 production so that debt service remains comfortably covered even in below-average years.
Massachusetts Example
The same 500 kW array would have a P90 of roughly 565,000 kWh/year. Debt is sized so that cash flow at P90 production still maintains at least 1.25x DSCR.
99% probability of exceeding
What It Means
The production level that will be exceeded in 99 out of 100 years — effectively the worst-case scenario short of catastrophic failure. Typically 15-20% below P50 for Massachusetts projects.
How Lenders Use It
Used for stress testing and downside scenarios. Some tax-equity investors require P99 DSCR to remain above 1.0x. Also used to size liquidated damages caps in performance guarantees.
Massachusetts Example
The 500 kW array would have a P99 of roughly 520,000 kWh/year. If actual production falls below P99 for two consecutive years, lenders typically require a root-cause analysis and corrective action plan.
When a lender underwrites a Section 48E-structured solar project with a Section 6418 credit transfer, they model debt service coverage at P90 rather than P50. The reason is asymmetric risk: if the borrower misses a debt service payment because of a low-irradiance year, the lender absorbs the default cost. If irradiance runs higher than expected, the extra cash flow benefits the sponsor, not the lender. Underwriting to P90 ensures that debt is covered in 9 out of 10 years.
The practical consequence is that lender-acceptable system sizes are smaller than what P50 economics would suggest. A sponsor pitching a 750 kW array based on P50 cash flows may find the bank will only finance 600 kW worth of debt because P90 cash flows drop the available debt service by roughly 10%. M&V reporting reinforces the discipline by surfacing any years where actual production approaches or breaches the P90 threshold, triggering lender review.
The production meter is the single most important piece of equipment in any commercial solar M&V plan. Every performance guarantee calculation, PPA invoice, SMART on-bill credit, tax-credit attestation, and lender covenant ultimately traces back to the kWh number that comes off this meter. Getting the accuracy class, data resolution, and communication path right at commissioning time costs a few thousand dollars; getting it wrong creates years of settlement disputes and guarantee enforcement problems.
| Specification | Revenue Grade (Required) | Utility Grade (Baseline) | Notes |
|---|---|---|---|
| Accuracy Class | ANSI C12.20 Class 0.2 | ANSI C12.20 Class 0.5 | Class 0.2 means plus or minus 0.2% full-scale accuracy — the standard required for PPA, SMART program, and tax-credit reporting. Class 0.5 is acceptable for supplementary system monitoring. |
| Measurement Standard | ANSI C12.1 / IEEE 1547 | ANSI C12.1 | C12.1 defines overall electric meter accuracy. IEEE 1547 governs the interconnection itself and requires the meter to record bidirectional flow at the point of common coupling. |
| Communication Protocol | DNP3, Modbus TCP, or cellular | Modbus RS-485 or Zigbee | Lenders and §6418 tax-credit buyers require remote access to meter data — typically via a cellular modem or encrypted IP connection with SCADA-grade reliability. |
| Data Resolution | 15-minute interval, kWh + kW demand | Hourly kWh | Fifteen-minute interval data is the lender and PPA standard because it enables accurate performance ratio calculations and ISO-NE settlement reconciliation. |
| Data Retention | 35+ days onboard, indefinite cloud archive | 7-14 days onboard | Onboard retention protects against communication outages. Cloud archival is required for audit trails — tax-credit buyers expect at least 10 years of retained 15-minute data. |
| Calibration | Factory certified, recalibrate every 10 years | Factory certified, recalibrate every 15 years | Massachusetts DPU rules require utility revenue meters to be recalibrated or replaced on a defined schedule. Owner-installed revenue-grade meters for performance guarantees should follow the same cycle. |
| Typical Models | Shark 200, ION 8650, E350, WattNode RWND | Itron Centron, Landis+Gyr E350 | The utility-installed meter is almost always revenue grade. The owner-side production meter should match or exceed its accuracy class to avoid settlement disputes. |
Massachusetts commercial solar that participates in ISO-NE settlement markets (typically arrays above 1 MW with wholesale market registration) must reconcile owner-side revenue meter data against ISO-NE Settlement Market Data (SMD). ISO-NE publishes 5-minute and hourly settlement quantities that the M&V workflow should download automatically each month. Any delta between the owner-side revenue meter and ISO-NE SMD above 0.5% should be flagged, investigated, and documented — these differences typically resolve to meter calibration drift, communication gaps, or CT/PT ratio errors.
A performance guarantee is only as strong as its contract language. Poorly drafted guarantees fail at enforcement time because they lack clear measurement methodologies, reasonable weather normalization, defined cure periods, or proportional liquidated damages. The five clause types below form the core of any institutionally-acceptable commercial solar performance guarantee.
Typical Language
System will produce at least 95% of weather-adjusted contracted production in each contract year, measured on a rolling 12-month basis.
Enforcement Mechanism
If measured production falls below 95% of weather-adjusted expected kWh in any measurement year, the O&M provider pays liquidated damages equal to the shortfall multiplied by the blended revenue rate (PPA rate plus SMART alternative on-bill credit rate).
Drafting Notes
The 95% threshold is the most common. Some PPAs use tiered structures — 95-100% no penalty, 90-95% partial damages, below 90% termination rights. Weather adjustment uses either measured POA irradiance or a TMY reference.
Typical Language
System will achieve at least 98% availability during daylight hours, where availability is defined as the inverter being in an operational state and exporting power within expected ranges.
Enforcement Mechanism
Each day below the availability threshold generates a per-day liquidated damage amount, calculated as the expected daily production times the blended revenue rate. Extended outages beyond 30 days give the owner termination rights.
Drafting Notes
Availability is easier to measure than production because it uses binary inverter-up/down states. Commonly paired with a production guarantee — one covers throughput, the other covers uptime.
Typical Language
The system will maintain a performance ratio of at least 0.80 during the first year and no less than 0.75 by year 25, where PR is the ratio of actual AC output to theoretical output at measured POA irradiance.
Enforcement Mechanism
PR shortfalls trigger a mandatory root-cause analysis within 30 days. Liquidated damages are calculated based on the difference between actual PR and guaranteed PR multiplied by expected energy at measured POA.
Drafting Notes
PR is the purest measure of system health because it normalizes for weather at the POA plane. Requires Class A or Secondary Standard pyranometers with annual recalibration. Preferred by technical lenders and OEMs.
Typical Language
Annual liquidated damages are capped at the lesser of 15% of annual O&M fees or 5% of annual revenue from the array.
Enforcement Mechanism
Caps protect the O&M provider from catastrophic liability while still providing meaningful financial incentive to maintain performance. Caps are sometimes removed for repeated or willful breaches.
Drafting Notes
Lenders and owners negotiate the cap carefully — too low and the guarantee has no teeth, too high and the O&M provider prices the risk into the base fee. A 10-15% annual cap is typical for standalone performance guarantees.
Typical Language
Production shortfalls caused by catastrophic weather (wind loads above design specification), utility curtailment, ISO-NE grid events, fire, vandalism, and force majeure are excluded from the guarantee calculation.
Enforcement Mechanism
The excluded hours are removed from both actual and expected production when calculating the guarantee. This prevents the O&M provider from being penalized for events outside their control.
Drafting Notes
Critical to define exclusions precisely. Utility curtailment has become more common in MA as solar penetration grows — pre-2020 contracts often omitted this and have required amendments.
One set of meter data feeds multiple stakeholders, each with different reporting needs and review cadences. The M&V workflow must deliver tailored reports to each audience on the schedule they require — what lenders want monthly is not what tax-credit buyers need annually, and both differ from the real-time data the operator uses to dispatch crews.
Report Contents
Measured gross production (kWh), weather-normalized expected production, performance ratio, inverter availability percentage, any alarm or fault events, revenue accrued (PPA, SMART alternative, net-metering credits), and YTD variance versus P90 budget.
Format and Delivery
Standardized PDF plus CSV of 15-minute interval data. Delivered via lender portal within 15 business days of month-end. Variances beyond plus or minus 10% require narrative explanation.
Report Contents
Contracted versus delivered kWh, environmental attribute production (RECs, SMART alternative on-bill credits), true-up calculations against contract baseline, and any performance guarantee breach calculations with proposed cure actions.
Format and Delivery
Invoice-grade quarterly report tied to billing cycle. Supports PPA true-up and any liquidated damages settlements. Archival cloud link retained for the full PPA term.
Report Contents
Annual production report certified by a licensed PE, recapture risk review, confirmation that the array remained in service for the tax year, domestic content records, and a narrative of any operational changes that might impact §48E qualification.
Format and Delivery
Formal engineer-stamped report delivered to the credit buyer by January 31 of the following year. Pairs with the annual §6418 transfer election documentation and provides defensive evidence in the event of IRS examination.
Report Contents
Monthly operating report with cash flow reconciliation, annual production true-up, tracking toward the flip target IRR, and insurance policy updates. Annual package includes PE-stamped performance confirmation and depreciation schedule confirmation.
Format and Delivery
Tax equity investors typically require the deepest reporting. Monthly dashboards plus an annual audit package. Any deviation from pro forma beyond 5% triggers a call with the investor asset management team.
Report Contents
Live dashboard with system-level and string-level performance, soiling trends, inverter fault history, revenue accrual, and maintenance backlog. Weekly executive summary highlighting week-over-week variance and open action items.
Format and Delivery
Web dashboard plus automated weekly email. Real-time alerts for any production drop exceeding 20% versus expected for more than 60 minutes during daylight hours.
The gap between a well-designed M&V plan and a failing one usually comes down to a handful of specific, predictable issues. Catching these at the engineering design phase costs a few thousand dollars in sensor upgrades; catching them years later after a guarantee dispute can cost tens of thousands in lost claims and attorney fees.
Impact: A 2-5% production loss from dust, pollen, and bird droppings is common across MA commercial arrays. Without a soiling station (a paired clean-and-natural pyranometer setup), it is nearly impossible to disaggregate soiling losses from other performance issues, weakening any performance guarantee claim.
Mitigation
Install a soiling measurement station on arrays above 500 kW. Clean quarterly during pollen-heavy spring months. Document cleaning dates in the M&V report so that pre-clean and post-clean production can be compared to quantify recovered kWh.
Impact: Central and string inverters begin derating (reducing output) when internal temperatures exceed design thresholds, typically above 45-50°C ambient. This is normal operation but can be mistaken for underperformance if the M&V report does not capture inverter temperature or clipping events.
Mitigation
Capture inverter internal temperature and AC clipping status in the SCADA data stream. Report clipping hours in monthly M&V reports so that any performance ratio drop during hot weeks is correctly attributed to derating rather than a defect.
Impact: Ground-mount arrays and rooftop arrays near tree lines accumulate shading losses as vegetation grows. A 3-5% production loss over 10 years from uncut tree lines is typical in New England. Since the original PVsyst model reflects year-one shading, uncut growth creates a persistent model-to-actual gap.
Mitigation
Include vegetation management in the O&M scope with annual growth surveys. Update the baseline simulation model every 3-5 years to reflect current shading conditions or use measured POA irradiance to sidestep the shading adjustment entirely.
Impact: Uncalibrated or drifting pyranometers introduce systematic bias into PR calculations. A 3% sensor drift translates into a 3% performance ratio error, which can either mask a real problem or trigger false positive guarantee claims.
Mitigation
Use Class A or Secondary Standard pyranometers with annual third-party recalibration. Pair the onsite sensor with a satellite irradiance feed (Clean Power Research SolarAnywhere, Solcast, Solargis) as a cross-check. Flag any sustained divergence above 5% for investigation.
Impact: Communication outages create gaps in the 15-minute interval meter record. If more than 2-3% of annual data is missing, the annual M&V report loses defensibility and some contracts trigger a breach notice for inadequate metering.
Mitigation
Use dual-path communications (cellular plus wired Ethernet). Maintain at least 35 days of onboard meter memory so short outages recover automatically. Document any gap in the M&V report with a clear interpolation methodology (typically linear interpolation using modeled irradiance).
Impact: Massachusetts commercial solar settles against ISO-NE locational marginal pricing for certain merchant structures. Misalignment between the owner-side revenue meter and the ISO-NE settlement meter data creates invoice disputes, especially in real-time imbalance markets.
Mitigation
Integrate ISO-NE SMD (Settlement Market Data) downloads into the monthly M&V workflow. Reconcile the owner-side revenue meter against ISO-NE settlement quantities each month and document any unexplained deltas above 0.5%.
Section 48E is the technology-neutral commercial investment tax credit that replaced the legacy Section 48 ITC for projects placed in service starting in 2025. For Massachusetts commercial solar above 1 MW, §48E is the primary federal incentive; the begin-construction window closed July 4, 2026, and projects starting now generally must be placed in service by December 31, 2027. The credit attaches to the array for the year it is placed in service, but the IRS has recapture authority for five years if the asset is disposed of or ceases to qualify as an energy property.
Section 6418 allows the project owner to transfer the §48E credit to an unrelated third party for cash — usually at 90-94 cents per dollar depending on credit quality, project stage, and buyer type. The buyer takes the credit on their own tax return and the seller receives immediate liquidity. Massachusetts has been an active transfer market since 2023, with corporate treasuries, insurance companies, and family offices all participating as buyers.
M&V reporting is the technical backbone of §6418 recapture defense. If the IRS examines a transferred credit and challenges that the underlying array remained in service or continued to qualify, the annual M&V report — PE-stamped, retained for at least 10 years, with meter-level evidence of continuous production — is the primary defense. Buyers now routinely require M&V representations in transfer agreements, and the market has priced poor M&V documentation into transfer discounts. Projects with institutional-grade M&V clear at the tight end of the pricing range; projects with weak reporting can see 3-5 cents per dollar of additional discount, translating to tens of thousands of dollars on a multi-megawatt array.
Panel, inverter, racking, and workmanship warranties plus O&M tiers from basic monitoring to premium performance guarantees.
Shading analysis, row-to-row spacing, and the shadow reports that permitting authorities and lenders now require.
The master guide to commercial solar costs, incentives, SMART 3.0, and Section 48E financing in Massachusetts.
How the §48E ITC works with third-party-owned arrays, PPA structures, and the step-ups buyers look for.
Transferability mechanics, pricing, buyer diligence, and the role M&V plays in defensible transfer packages.
Municipal permits, ISO-NE interconnection, utility approvals, and the sequence that keeps projects on schedule.
Utility primary metering thresholds, CT/PT arrangements, and the metering choices that affect SMART and NEM revenue.
System-level, string-level, and panel-level monitoring options plus the data flows that M&V workflows depend on.
IPMVP stands for the International Performance Measurement and Verification Protocol, published by the Efficiency Valuation Organization. It is the globally recognized framework for measuring and verifying energy savings and generation. For Massachusetts commercial solar projects at 250 kW and up, IPMVP compliance matters because PPA offtakers, lenders, tax-equity investors, and Section 6418 transferable credit buyers all expect M&V plans that map to one of the four IPMVP options (A, B, C, or D). Most commercial PV arrays use Option C (whole-facility measurement) or Option D (calibrated simulation). Without a documented IPMVP-aligned M&V plan, performance guarantees become difficult to enforce, lender underwriting tightens, and tax-credit transfer buyers apply larger pricing discounts to reflect perceived verification risk.
0.2%
ANSI C12.20 meter accuracy
15 min
Standard interval data
95%
Typical production guarantee
10 yr
M&V archive retention
NuWatt builds IPMVP-aligned M&V plans, revenue-grade metering packages, and institutional reporting workflows for Massachusetts commercial solar projects 250 kW and up. Ready to support Section 48E underwriting and Section 6418 transfer diligence from day one.