Loading NuWatt Energy...

We use your location to provide localized solar offers and incentives.
We serve MA, NH, CT, RI, ME, VT, NJ, PA, and TX
Loading NuWatt Energy...
NuWatt designs, installs, and manages solar, battery, heat pump, and EV charger systems across 9 states. One company, one warranty, one point of contact.
Get a Free QuoteMassachusetts updated the SMART program with an annual rate review mechanism, utility-specific capacity allocations, and revised adder values effective January 2026. This deep analysis covers every change, who is affected, and how to maximize your SMART value under the new rules.
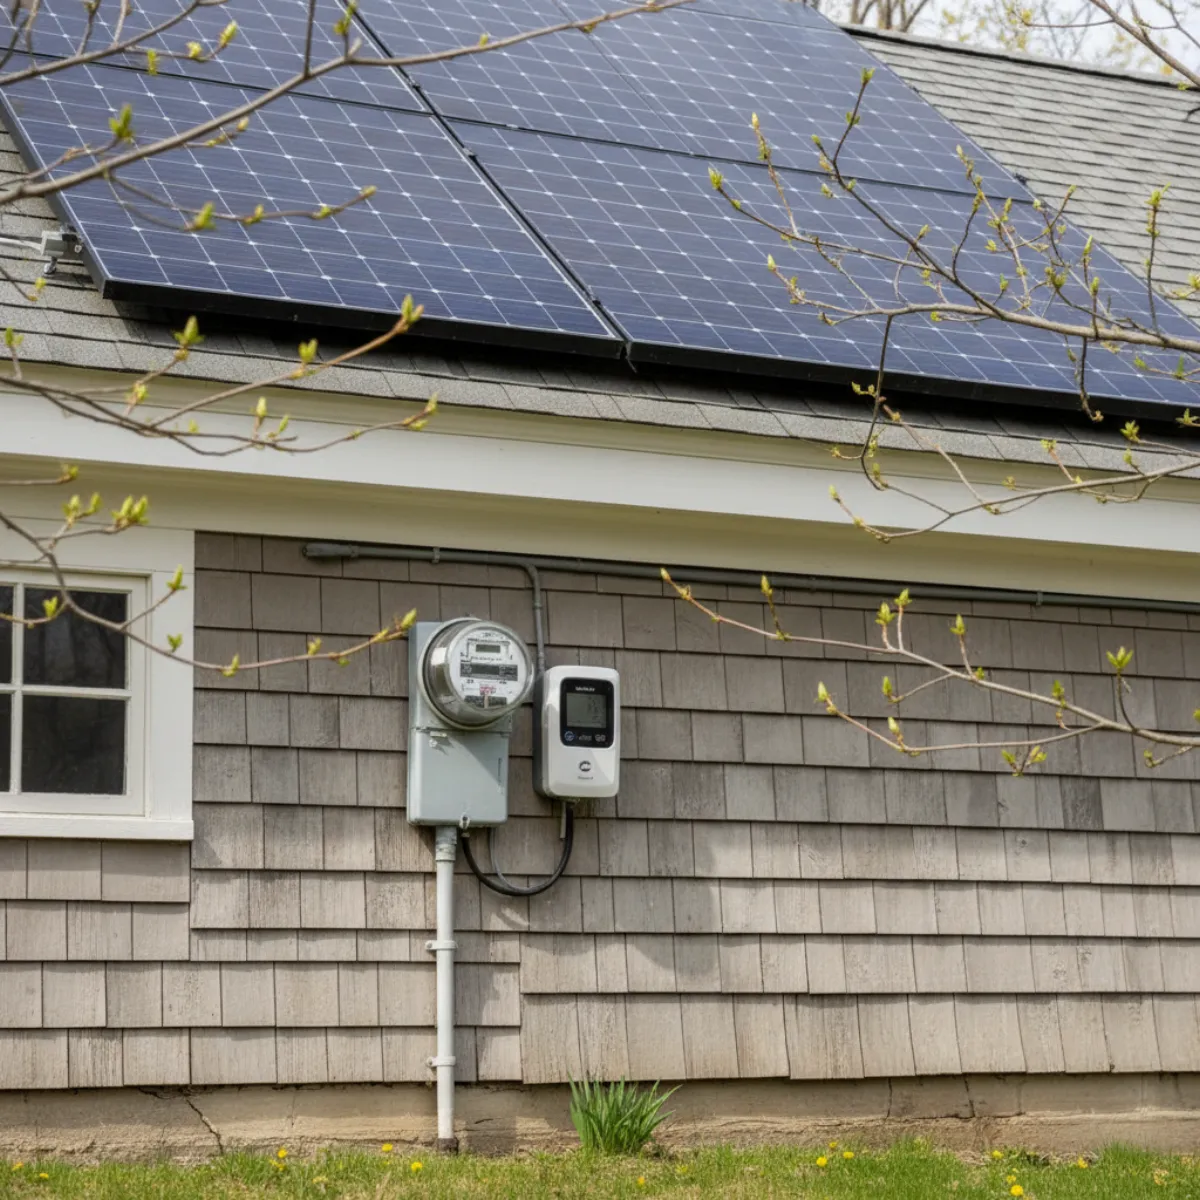
Massachusetts introduced three major SMART program changes effective January 2026: (1) an annual rate review mechanism where the DOER reassesses base compensation rates each January based on wholesale electricity prices and program participation, (2) utility-specific capacity allocations replacing the shared pool (Eversource 1,500 MW, National Grid 1,400 MW, Unitil 300 MW), and (3) updated adder values including a higher battery storage adder for 4+ hour systems ($0.045/kWh) and a tiered low-income adder ($0.04-0.06/kWh based on AMI level).
The Massachusetts Department of Energy Resources (DOER) finalized revisions to the Solar Massachusetts Renewable Target (SMART) program regulations effective January 1, 2026. These changes represent the most significant structural update since the transition from SMART 2.0 to SMART 3.0 in 2023. While the core program mechanics remain intact — fixed $/kWh payments for 20 years that stack with net metering — the 2026 revisions introduce new flexibility and complexity that homeowners and commercial solar customers need to understand.
NOT Affected (Grandfathered)
Affected (New Rules Apply)
The most consequential change is the introduction of an annual rate review process. Under the original SMART 3.0 framework, the DOER set base compensation rates when the program version launched and those rates applied to all new enrollees until the next program version. Under the 2026 revision, rates are now reviewed and potentially adjusted every January.
Data Collection (October - November)
DOER collects the previous 12 months of ISO-NE wholesale electricity prices (locational marginal prices), program enrollment data, and grid value assessments from the three investor-owned utilities.
Rate Calculation (November - December)
DOER applies a formula that accounts for changes in wholesale prices, program demand, and the avoided cost value of distributed solar. The formula is designed to keep incentive levels aligned with actual market conditions rather than setting them once and leaving them static.
Public Comment (December)
Proposed rates are published for a 30-day public comment period. Industry stakeholders, utilities, and consumer advocates can submit feedback before rates are finalized.
New Rates Published (January 1)
Program Year (PY) rates take effect. All new applications submitted during that calendar year lock in at the PY rate. Once locked, the rate is fixed for the full 20-year term — the annual review only affects rates for future enrollees.
The annual review introduces a degree of uncertainty for people planning to install solar in future years. If you are considering solar for 2027 or later, your SMART rate may be higher or lower than the current $0.03/kWh residential rate. However, historical wholesale electricity price trends in Massachusetts have been generally upward — average wholesale prices rose from $0.042/kWh in 2020 to $0.068/kWh in 2025 — which could support equal or slightly higher SMART rates in coming years. That said, the DOER has broad discretion in setting rates, and higher wholesale prices do not guarantee higher SMART rates.
Bottom line: If you are ready to go solar now, lock in the current PY2026 rate. Do not gamble on future rates being higher.
Some homeowners mistakenly believe the annual rate review means their SMART payments will change every year. This is incorrect. Once you enroll and your application is approved, your rate is locked for 20 years. The annual review only determines the starting rate for new enrollees in each program year. Think of it like a mortgage rate: you lock in when you close, and future rate changes do not affect your existing loan.
Under the old model, the program's 3,200 MW total capacity was a shared pool. Any project in any utility territory drew from the same allocation. This created an imbalance: Eversource territory, with the highest population density and most solar demand, consumed capacity faster than National Grid or Unitil territories. The 2026 revision assigns each utility its own capacity allocation, with sub-blocks to ensure balanced development across residential, commercial, and large-scale categories.
| Utility | Total Allocation | Claimed | Remaining | % Used |
|---|---|---|---|---|
| Eversource | 1,500 MW | ~1,180 MW | ~320 MW | 79% |
| National Grid | 1,400 MW | ~950 MW | ~450 MW | 68% |
| Unitil | 300 MW | ~210 MW | ~90 MW | 70% |
| Utility | Residential (<25 kW) — 60% | Commercial (25 kW-1 MW) — 25% | Large-Scale (>1 MW) — 15% |
|---|---|---|---|
| Eversource | 900 MW | 375 MW | 225 MW |
| National Grid | 840 MW | 350 MW | 210 MW |
| Unitil | 180 MW | 75 MW | 45 MW |
~320 MW
remaining capacity
79% of 1,500 MW claimed
~450 MW
remaining capacity
68% of 1,400 MW claimed
~90 MW
remaining capacity
70% of 300 MW claimed
Eversource customers (Boston, Worcester, Springfield, Cape Cod): With 79% of capacity claimed and the highest installation rate in the state, Eversource territory is approaching capacity constraints first. At current enrollment rates, the residential sub-block could be fully claimed within 18-24 months. Homeowners in Eversource territory should prioritize SMART enrollment to avoid missing out.
National Grid customers (central and western MA): With 68% claimed and slower enrollment velocity, National Grid territory has the most runway. Residential customers likely have 24-36 months before capacity constraints become a factor. However, commercial projects are filling faster — the 25 kW-1 MW sub-block is 74% claimed.
Unitil customers (Fitchburg area): The smallest territory with 300 MW. At 70% claimed, Unitil has approximately 90 MW remaining. The limited service area means fewer installations but also limited capacity. Unitil customers should not delay enrollment.
SMART adders are bonus payments on top of the base rate that reward specific system attributes like battery storage, building-mounted installation, or low-income qualification. The 2026 revisions updated two adder categories and added new verification requirements to a third. Here is the complete comparison:
| Adder | Previous Rate | PY2026 Rate | Change | Impact |
|---|---|---|---|---|
| Battery Storage (4+ hr) | $0.04/kWh | $0.045/kWh | +$0.005 | Encourages longer-duration storage |
| Battery Storage (2 hr) | $0.04/kWh | $0.04/kWh | No change | Remains available for standard batteries |
| Low-Income (≤60% AMI) | $0.05/kWh | $0.06/kWh | +$0.01 | Deeper subsidy for lowest-income households |
| Low-Income (60-80% AMI) | $0.05/kWh | $0.04/kWh | -$0.01 | Tiered income qualification introduced |
| Building-Mounted | $0.02/kWh | $0.02/kWh | No change | Most residential rooftop systems qualify |
| Canopy / Carport | $0.08/kWh | $0.08/kWh | No change | Highest single adder, mostly commercial |
| Community Solar | $0.07/kWh | $0.07/kWh | No change | Unchanged for multi-subscriber projects |
| Dual-Use Agriculture | $0.09/kWh | $0.09/kWh | No change | Now requires annual third-party ag verification |
| Brownfield | $0.04/kWh | $0.04/kWh | No change | Unchanged |
| Public Entity | $0.04/kWh | $0.04/kWh | No change | Unchanged |
| Pollinator-Friendly | $0.01/kWh | $0.01/kWh | No change | Unchanged |
The battery storage adder now has two tiers based on storage duration. Systems with 4+ hours of storage at rated capacity (e.g., a 5 kW / 20 kWh battery) receive $0.045/kWh, while standard 2-hour systems (e.g., a 5 kW / 10 kWh battery like the Tesla Powerwall 3) continue at $0.04/kWh. This change is designed to incentivize longer-duration storage that provides more grid value during extended peak periods and winter demand events.
Standard Battery (2-hr, $0.04/kWh)
10 kW system: $480/year from battery adder
20-year value: $9,600
Example: Tesla Powerwall 3 (13.5 kWh)
Long-Duration Battery (4+ hr, $0.045/kWh)
10 kW system: $540/year from battery adder
20-year value: $10,800
Example: 2x Powerwall 3 or Franklin aPower2
Difference: $60/year or $1,200 over 20 years for longer-duration storage. Whether the extra battery capacity justifies its cost depends on your backup power needs and ConnectedSolutions revenue.
The most impactful adder change for qualifying households is the tiered low-income structure. Previously, all households at or below 80% of Area Median Income (AMI) received the same $0.05/kWh adder on top of the $0.06/kWh low-income base rate. Under the 2026 rules:
$0.06/kWh adder
Households at ≤60% AMI
Total SMART rate: $0.06 base + $0.06 adder = $0.12/kWh
10 kW system: $1,440/year from SMART alone
$0.04/kWh adder
Households at 60-80% AMI
Total SMART rate: $0.06 base + $0.04 adder = $0.10/kWh
10 kW system: $1,200/year from SMART alone
The tiered structure means the lowest-income households receive more support than before ($0.01/kWh increase), while households closer to the 80% AMI threshold see a $0.01/kWh decrease. The net effect is that SMART incentives are now more progressively distributed based on financial need.
| Feature | SMART 2.0 (2020-2023) | SMART 3.0 (2023-2025) | SMART 3.0 Revised (2026+) |
|---|---|---|---|
| Rate Structure | Declining capacity blocks (Blocks 1-8) | Flat rate per category | Flat rate with annual review |
| Residential Base Rate | $0.14-0.20/kWh (block dependent) | $0.03/kWh | $0.03/kWh PY2026 (subject to annual review) |
| Rate Lock | Locked at block enrollment for 20 years | Locked at enrollment for 20 years | Locked at enrollment for 20 years |
| Capacity Allocation | Shared pool across all utilities | Shared pool, 3,200 MW total | Utility-specific: Eversource 1,500 / NGrid 1,400 / Unitil 300 |
| Sub-Block Structure | None — first-come, first-served | None | 60% residential / 25% commercial / 15% large-scale |
| Battery Adder | $0.04/kWh | $0.04/kWh | $0.04-0.045/kWh (duration-based) |
| Low-Income Adder | $0.05/kWh (single tier) | $0.05/kWh (single tier) | $0.04-0.06/kWh (tiered by income) |
| Ag Verification | Self-reported | UMass review | Annual third-party verification required |
| Program Duration | 20-year tariff | 20-year tariff | 20-year tariff (unchanged) |
| Net Metering Stacking | Yes | Yes | Yes (unchanged) |
SMART 1.0 regulations finalized by DOER
First SMART applications accepted; initial blocks opened
SMART 2.0 approved; capacity doubled from 1,600 MW to 3,200 MW
New adder categories added (canopy, pollinator, community solar expanded)
SMART 3.0 finalized; flat rate model replaces declining blocks
SMART 3.0 rates take effect; residential set at $0.03/kWh
DOER announces 2026 rule revisions for public comment
Annual rate review mechanism and utility-specific capacity blocks take effect
First annual rate review: PY2027 rates to be published (projected)
| Year | Version | Residential Rate | Commercial Rate | Rate Mechanism |
|---|---|---|---|---|
| 2018 | SMART 1.0 | $0.18-0.25/kWh | $0.14-0.22/kWh | Declining capacity blocks (8 blocks per utility) |
| 2020 | SMART 2.0 | $0.14-0.20/kWh | $0.10-0.16/kWh | Declining blocks, expanded capacity to 3,200 MW |
| 2023 | SMART 3.0 | $0.03/kWh flat | $0.06-0.10/kWh formula | Flat rate replaces blocks |
| 2026 | SMART 3.0 (Revised) | $0.03/kWh (PY2026) | $0.06-0.10/kWh (PY2026) | Annual rate review + utility-specific capacity blocks |
The trend is clear: residential base rates have declined significantly from $0.18-0.25/kWh in 2018 to $0.03/kWh in 2026. This reflects declining solar installation costs and the program's shift from a generous early-adopter incentive to a market-sustaining mechanism. However, this decline must be viewed in context. Early SMART rates were set when solar panel costs were $3.50-4.00/W installed. With 2026 costs at $2.75-3.25/W and no federal residential ITC, the $0.03/kWh base rate plus adders still provides meaningful value — especially when stacked with net metering savings of $2,270+/year.
Typical Residential SMART Income (10 kW):
Base: $360/yr + Building: $240/yr + Battery: $480-540/yr
= $1,080-1,140/year for 20 years
Typical Commercial SMART Income (100 kW):
Formula rate: ~$0.08/kWh x 120,000 kWh/year
= ~$9,600/year for 20 years
The annual rate review creates a new question for prospective solar customers: should you lock in the PY2026 rate now, or wait for PY2027 rates that might be higher? Here is a data-driven framework for making that decision:
Enroll Now (PY2026)
Rate: $0.03 base + $0.02 building + $0.04 battery = $0.09/kWh
10 kW system: $1,080/year x 20 years = $21,600
Payments start immediately
Wait for PY2027 (best case +$0.005)
Rate: $0.035 base + $0.02 building + $0.04 battery = $0.095/kWh
10 kW system: $1,140/year x 19 years = $21,660
Lost 1 year of payments ($1,080)
Even in the best case (+$0.005/kWh increase for PY2027), waiting 12 months results in approximately the same 20-year total. In a flat or declining rate scenario, you lose money by waiting. The math overwhelmingly favors enrolling now.
One of the most common questions about the 2026 rule changes is whether they affect net metering or ConnectedSolutions. The short answer: no. All three programs remain independent and fully stackable. Here is how each program works within the updated framework:
What it pays: Fixed $/kWh based on total generation (every kWh your system produces, whether consumed on-site or exported)
2026 change: Annual rate review for new enrollees; utility-specific capacity blocks
PY2026 residential: $0.03/kWh base + adders ($0.02-0.09/kWh)
What it pays: Bill credits for excess electricity exported to the grid, valued at the current retail rate
2026 change: None. Net metering is governed by DPU regulations, not DOER SMART rules
Typical value: $2,270+/year for a 10 kW system in MA (based on current ~$0.33/kWh retail rates)
What it pays: Seasonal payments for allowing your battery to discharge during grid peak events
2026 change: None. ConnectedSolutions is a utility demand response program managed separately
Typical value: $500-800/year for a single battery (Eversource: $225/kW winter, $50/kW summer)
Based on 10 kW system, 12,000 kWh/year production, Eversource territory, PY2026 SMART rates, standard 2-hour battery adder. Actual values vary by system size, utility territory, and usage pattern.
The new duration-based battery adder creates a strategic question: should you size your battery for the higher $0.045/kWh adder (4+ hours) or stick with a standard system at $0.04/kWh? The answer depends on your priorities and budget.
A single Tesla Powerwall 3 (13.5 kWh, 11.5 kW) or Enphase IQ 5P (5 kWh per unit, 2 units = 10 kWh) provides 2-3 hours of whole-home backup and qualifies for the $0.04/kWh SMART adder. This is the most cost-effective approach for homeowners whose primary goals are backup power and SMART income.
Battery cost: $10,000-14,000 installed
SMART adder income: $480/year (10 kW system)
ConnectedSolutions: $500-800/year
Total battery revenue: $980-1,280/year
Payback from revenue alone: 8-14 years
Two Tesla Powerwall 3 units (27 kWh total) or a Franklin aPower2 (15 kWh per unit, 2 units = 30 kWh) provide 4+ hours of duration and qualify for the $0.045/kWh adder. This costs more upfront but provides longer outage protection, higher ConnectedSolutions revenue, and the premium SMART adder.
Battery cost: $18,000-26,000 installed
SMART adder income: $540/year (10 kW system)
ConnectedSolutions: $900-1,400/year (higher capacity)
Total battery revenue: $1,440-1,940/year
Payback from revenue alone: 9-18 years
For most residential customers, Strategy A (standard battery) offers the best return on investment. The $0.005/kWh adder increase for longer-duration storage adds only $60/year for a 10 kW system — not enough to justify the $8,000-12,000 additional battery cost on SMART economics alone. However, if you live in a storm-prone area, experience frequent outages, or want maximum ConnectedSolutions revenue, Strategy B can make sense.
The most significant change is the introduction of an annual rate review and reset mechanism. Under the old SMART 2.0 model, your tariff rate was locked at enrollment and never changed for the program's life. Under the 2026 rule changes, the DOER now conducts an annual review of the base compensation rates each January, adjusting them based on wholesale electricity prices, program participation rates, and grid value assessments. This means rates for new enrollees may shift up or down each program year. However, once you enroll and lock in your rate, it remains fixed for your full 20-year term. The changes also restructured capacity blocks, updated several adder values, and introduced differentiated allocations by utility territory.
NuWatt handles your entire SMART application — from paperwork to approval to your first payment. Get a free quote and see your projected SMART income.
Last updated March 29, 2026. SMART program data sourced from Massachusetts DOER SMART Program regulations (225 CMR 20.00), PY2026 rate schedules, and utility capacity filings. Capacity utilization data is approximate based on MassCEC SMART database as of March 2026. NuWatt is a qualified SMART installer in all three IOU territories.