Loading NuWatt Energy...

We use your location to provide localized solar offers and incentives.
We serve MA, NH, CT, RI, ME, VT, NJ, PA, and TX
Loading NuWatt Energy...
NuWatt designs, installs, and manages solar, battery, heat pump, and EV charger systems across 9 states. One company, one warranty, one point of contact.
Get a Free Quote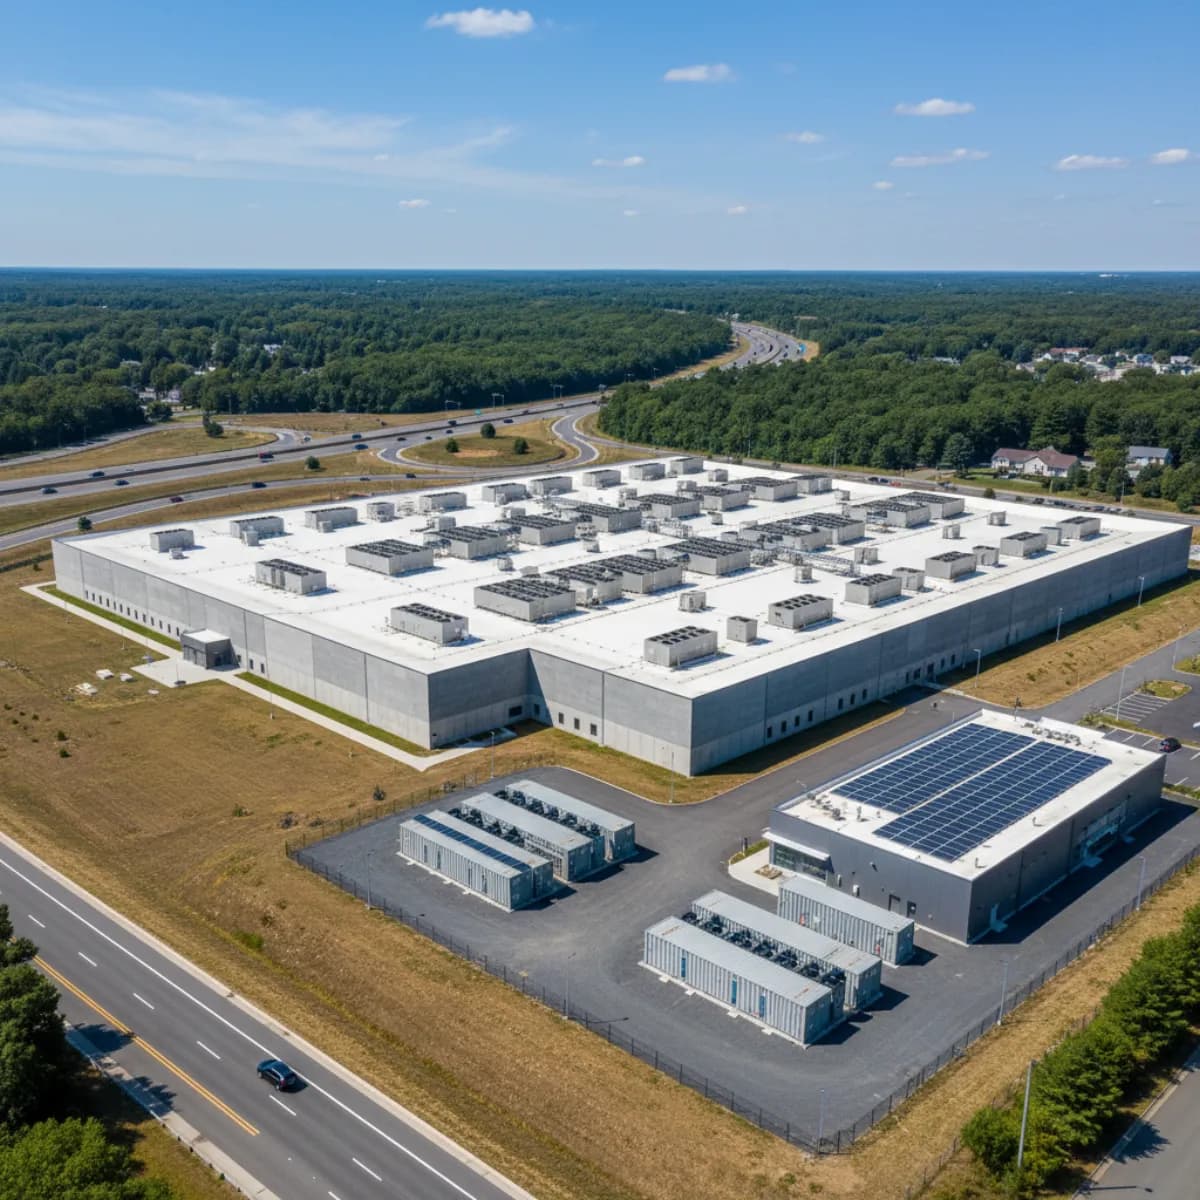
AI and colocation demand is surging along the Westborough/Marlborough corridor. With rooftop solar capped at under 5% of typical data center load, virtual PPAs paired with behind-the-meter battery storage are the dominant MA strategy for Scope 2 RECs, ConnectedSolutions revenue, and 24/7 carbon-free energy matching in ISO-NE.
MA Data Center Load
600+ MW
Growing 15-20% annually
Rooftop Solar Fit
<5%
Of typical 24/7 IT load
VPPA Strike (TX/PJM)
3-4.5¢
Bundled Class I-equivalent RECs
BESS Revenue Stack
$200-450
Per kW-year (CS + Clean Peak)
Massachusetts data centers almost never source the majority of their load from on-site solar. A typical MA facility fits 0.5-2 MW of rooftop PV on a building drawing 10-50 MW of continuous 24/7 IT load — rooftop coverage rarely exceeds 5%. The dominant strategy is a virtual PPA (VPPA) with a utility-scale solar project in ERCOT, PJM, or ISO-NE: the generator sells into its local wholesale market, the data center pays or receives the difference against a fixed strike price, and the renewable energy credits are transferred for Scope 2 reporting. This is paired with behind-the-meter battery storage for ConnectedSolutions demand-response revenue, Clean Peak Energy Certificates, and peak-shaving against Eversource and National Grid transmission and capacity charges. Rooftop and carport solar remain relevant for admin-and-cooling-support load, sustainability signaling, and modest SMART 3.0 revenue — but the Scope 2 accounting work is done by the off-site VPPA.
Massachusetts is not a top-tier national data center market by capacity — ISO-NE retail rates, constrained land, and winter gas pricing see to that — but it is a rapidly growing regional hub driven by Boston financial services, Cambridge biotech and life sciences, and the AI/ML research cluster anchored by MIT, Harvard, and the Route 128/495 ecosystem. The state hosts roughly 600 MW of active data center load across colocation, enterprise, and edge deployments, with the Westborough/Marlborough corridor along Route 495 functioning as the primary colocation cluster.
The growth pattern is distinct from Texas or Northern Virginia: MA data centers are typically medium-scale colocation (5-20 MW) and edge facilities (1-5 MW) rather than 100+ MW hyperscale campuses. Tenant mix skews toward latency-sensitive financial trading, biotech HIPAA/life-sciences workloads, and regional cloud edge nodes for the three major hyperscalers. This creates distinct solar procurement dynamics: physical footprint is constrained (rooftop solar covers a small fraction of load), but tenant sustainability demands and MA Climate Act reporting push operators toward sophisticated VPPA and Class I REC strategies.
Solar strategy in MA therefore looks less like “build a 50 MW ground mount next to the data center” and more like a layered procurement stack: modest on-site PV for the admin and cooling-support meter, behind-the-meter BESS for peak shaving and ConnectedSolutions revenue, and one or more off-site VPPAs to cover the remaining 90%+ of load for Scope 2 matching.
MA primary data center cluster
Solar Strategy: National Grid territory with mature interconnection, dense fiber routes along Route 495, ConnectedSolutions commercial battery program participation, proximity to Boston financial and biotech load centers.
Financial + biotech colocation hub
Solar Strategy: Eversource territory with the highest commercial retail rates in ISO-NE, making off-site Class I VPPAs and peak-shaving BESS especially valuable; dense urban sites mean rooftop solar is marginal and procurement strategy dominates.
NH-proximal edge market
Solar Strategy: Access to both MA Class I RECs and NH renewable resources; sites often span the MA/NH border with workforce and power draw from both states. Land availability supports mid-scale on-site solar where rooftop permits.
Emerging secondary market
Solar Strategy: Lower land costs enable larger on-site carport and ground-mount arrays; SMART 3.0 incentives stack with commercial solar economics for sites under 5 MW AC; proximity to National Grid distribution.
Mid-sized as the Massachusetts market is, AI is dragging rack density up from the old 5-8 kW norm toward 30-80+ kW. One 20-rack GPU pod can pull 1-2 MW around the clock — enough to double the IT load of a small Westborough colocation hall on its own. Drop that incremental megawatt onto an ISO-NE grid squeezed by winter gas and carrying some of the steepest commercial rates in the nation, and the payoff from a locked-in VPPA strike and a peak-shaving battery grows with every rack added.
30-80+
kW/rack (AI clusters)
14-22¢
All-in retail $/kWh (MA)
3-5 yr
ISO-NE interconnection queue
A data center holds 95-99% of its nameplate draw every single hour, day and night. Run a 10 MW hall for a year and it burns about 87,600 MWh — the annual electricity of roughly 10,000 Massachusetts households. What defines the curve is its flatness: no weekend lull, no 3 AM trough, only a slight summer cooling bulge. That is the whole reason a rooftop array cannot carry the building on a Route 495 site. Massachusetts PV yields just 16-18% of nameplate across the year, bunched into the 9 AM-to-4 PM window, so even the physically unusual case of a fully roofed-over facility produces a thin slice of annual megawatt-hours — and nothing after dark, when the racks keep pulling full power against Eversource or National Grid supply.
24/7 baseload, cooling-dominant, distributed MA locations
Annual Load
8,760-43,800 MWh/year
Rack Density
5-8 kW/rack
PUE Target
1.3-1.5
Typical Procurement
Green tariff or small VPPA + on-site BESS
Solar Fit in MA: On-site rooftop (0.3-1.5 MW AC) typically covers 3-8% of annual load. Dense urban sites often have <5% rooftop coverage. BESS for peak shaving and ConnectedSolutions revenue. Small VPPA or green tariff for the remaining ~95%+.
High density, 2N redundant power, multi-tenant, tenant-driven renewable demand
Annual Load
43,800-175,200 MWh/year
Rack Density
8-15 kW/rack
PUE Target
1.2-1.4
Typical Procurement
Off-site VPPA + on-site BESS
Solar Fit in MA: On-site rooftop + carport (1-3 MW AC) covers 2-5% of load. Off-site VPPA (10-50 MW) required for meaningful Scope 2 reduction. Behind-the-meter BESS for 4-hour peak shaving + ConnectedSolutions + Clean Peak revenue stack.
Campus-scale, single-tenant, multi-decade PPA portfolios, 24/7 CFE commitments
Annual Load
175,200-876,000+ MWh/year
Rack Density
10-30+ kW/rack (AI/GPU clusters)
PUE Target
1.1-1.3
Typical Procurement
Multi-region VPPA portfolio + optional on-site BESS
Solar Fit in MA: On-site solar is typically under 2% of load — symbolic rather than material. Multi-PPA portfolio across ISO-NE, PJM, or ERCOT via VPPA is the core strategy. Dedicated utility-scale solar + wind + storage contracts to approach 24/7 hourly CFE matching.
Walk any Massachusetts colocation or enterprise hall and the rooftop PV lands in the same place: below 5% of yearly kWh. Work the numbers — 50,000 sq ft of roof carries maybe 0.5-0.8 MW AC, which at New England irradiance throws off 700-1,100 MWh a year, while a 5 MW hall eats 43,800 MWh. The gap is physics, not ambition: watts of silicon per square meter cannot chase watts of GPU per square meter. That is why off-site contracting on this page is treated as the load-bearing strategy and rooftop as the garnish.
Data center operators in Massachusetts have five primary solar and renewable energy procurement paths, each with distinct cost profiles, accounting treatment, and REC eligibility. Most hyperscale operators build a portfolio — small on-site for signaling and admin load, behind-the-meter BESS for revenue stacking, and one or more off-site VPPAs for the overwhelming majority of Scope 2 claims. The specific portfolio depends on whether the operator needs MA Class I RPS compliance (rare for voluntary corporate claims) or Scope 2 market-based accounting (universal).
Capacity: 100 kW - 2 MW AC
Complexity: Low
Accounting: Operating expense (PPA) or capital asset (§48E owned, or leased via §6418 transfer)
Capacity: 1-5 MW AC
Complexity: Medium
Accounting: Operating expense (PPA) or capital asset
Capacity: 5-50 MW AC
Complexity: High
Accounting: Operating expense (service contract)
Capacity: 10-500+ MW AC
Complexity: Very High
Accounting: Financial derivative (ASC 815 mark-to-market)
Capacity: Any (utility-mediated)
Complexity: Low
Accounting: Operating expense (bundled with utility supply)
For-profit data center operators use Section 48E Clean Electricity Investment Tax Credit (30% base, plus bonus adders for domestic content and energy communities) paired with 5-year MACRS accelerated depreciation and 100% first-year bonus depreciation (permanent under OBBBA). §48E follows a dual timing pathway: projects that began construction on or before July 4, 2026 locked in the most flexible placed-in-service window, and projects starting now still qualify if placed in service by December 31, 2027. If the operator's tax appetite cannot fully absorb the credit, Section 6418 transferability allows the credit to be sold to an unrelated taxpayer for cash at roughly $0.90-$0.95 per dollar of credit — common for colocation REITs and newer hyperscale entities without legacy tax capacity. Coordinate with a qualified tax advisor before signing.
A virtual PPA (VPPA) is a financial contract for differences paired with a REC transfer — it is not a supply agreement. Under a VPPA, the generator (typically a utility-scale solar farm in ERCOT, PJM, or MISO) sells its output into its local wholesale market at real-time or day-ahead prices. The data center continues to take retail supply from its local utility — in MA, that is Eversource, National Grid, or Unitil. The VPPA sits on top as a financial swap: the data center agrees to pay the generator a fixed strike price per MWh, and in return receives the wholesale market price plus the RECs for every MWh generated.
The settlement runs both directions. Whenever the wholesale price clears above the strike, the generator cuts a check to the data center (a hedge gain); whenever it clears below, the money flows the other way (a hedge loss). Across a full year those swings are engineered to roughly cancel, because the strike is set near the generator's expected long-run wholesale revenue. The durable value is elsewhere: the RECs retired for the Massachusetts operator's Scope 2 books, and the price certainty that pins down a slice of energy cost for 12-20 years while ISO-NE retail rates keep climbing.
Generator Side (in ERCOT)
Data Center Side (in MA)
Net economic outcome: With the strike near ~$35/MWh and the ERCOT long-run average around ~$35-40/MWh, settlement washes out to roughly neutral over the life of the deal. What the Massachusetts operator actually banks: full annual REC matching, a multi-year price hedge against ISO-NE volatility, and a documented climate commitment on the balance sheet.
High — fully exposed to ISO-NE winter price spikes and capacity charges
10 MW annual: $12.3M-$19.3M
Eversource and National Grid commercial rates for large load are the highest in the continental US. ISO-NE winter natural gas constraints routinely push wholesale prices above $200/MWh. Capacity charges from the Forward Capacity Market add $15-30/kW-year. Transmission and distribution demand charges compound the exposure.
High — rooftop is symbolic, not a material hedge
10 MW annual: $11.4M-$18.4M
Rooftop offsets a single-digit percent of load on the office/support meter. Useful for sustainability signaling and modest demand-charge relief, but the overwhelming share of 24/7 data center load still rides the retail tariff. Pair with BESS and a VPPA to make a dent.
Medium — Scope 2 covered, ISO-NE retail exposure remains
10 MW annual: $11.4M-$15.8M
A ~30-60 MW VPPA struck at $30-$45/MWh generates enough Class I-equivalent RECs to claim 100% annual matching. The hedge gain/loss flows to P&L via ASC 815. Retail supply from Eversource/National Grid continues in parallel — the VPPA does not displace physical delivery. Most common path for hyperscale Scope 2 goals.
Lower — peak shaving + dispatch revenue offsets retail cost
10 MW annual: $9.6M-$14.0M
A 5-20 MW / 4-hour battery shaves the ICAP tag and transmission peak, earning ConnectedSolutions summer dispatch payments ($200-$300/kW-summer) and Clean Peak Energy Certificates during the summer/winter peak windows. Stacks cleanly on top of an off-site VPPA for Scope 2.
Very Low — 90%+ hourly matching, diversified across ISO regions
10 MW annual: $10.5M-$14.9M
Combines in-region solar/wind PPAs (for ISO-NE hourly matching), out-of-region VPPAs (for cost-effective volume), and behind-the-meter BESS (for peak shaving and short-duration firming). This is the Google/Microsoft playbook adapted for MA. Expensive to design, but the only credible path to granular hourly CFE claims.
Under US GAAP a VPPA is a derivative, so absent an elected and well-supported hedge-accounting designation it marks to market on the balance sheet each quarter. Those fair-value swings are not cosmetic — a 50 MW contract riding a $10/MWh move in the forward curve can throw off $1-2 million of quarterly P&L noise across a 15-year term. Before signing, a Massachusetts operator's finance team should stress the downside cases (wholesale prices parked below the strike, or the extended negative-price stretches that hit oversupplied spring markets) and weigh hedge-accounting qualification to keep reported earnings clean.
The bar is rising from annual matching — buy enough certificates to cover a year's total draw — to hourly matching, where an operator has to show a carbon-free generation hour on the same grid for every consumption hour. Google's 24/7 CFE method and Microsoft's 100/100/0 target set the template. Doing it inside ISO-NE is a harder problem than in ERCOT or MISO: New England PV clears only 16-18% capacity factor against 22-28% in West Texas, onshore wind is thin, and the winter gas squeeze drives the grid's residual carbon intensity up precisely during the coldest hours a Massachusetts data center is trying to cover.
A defensible Massachusetts 24/7 portfolio therefore stacks four pieces: in-region solar PPAs to carry Class I-eligible daytime hours, offshore wind PPAs (Vineyard Wind, Revolution Wind, and the projects behind them, which run hardest in winter), a behind-the-meter battery for short-duration firming and peak shaving, and an agreed grid-backstop allowance for the multi-day generation droughts a polar vortex brings. The blended number typically settles at $0.08-$0.12/kWh — dearer than an annual-matching VPPA, but the only honest route to hour-by-hour carbon claims on the New England grid.
| Strategy | Hourly Match | Annual Match | Coverage Gap | Blended Cost |
|---|---|---|---|---|
| Annual RECs Only (Unbundled) | Not measured | 100% | No hourly signal — widely criticized as greenwashing | $0.005-$0.02/kWh (REC adder) |
| VPPA — Annual Volumetric Matching | ~30-40% | 100% | No coverage nights/winter mornings; overproduction during shoulder seasons | $0.03-$0.045/kWh (strike) |
| Solar VPPA + 4hr BESS (On-Site) | ~45-55% | 100% | Winter evenings and multi-day storm periods uncovered | $0.06-$0.09/kWh (blended) |
| Solar + Wind VPPA Portfolio | ~65-80% | 100% | Low-wind/low-sun days (polar vortex weeks) | $0.05-$0.08/kWh |
| Full 24/7 CFE Portfolio (Solar + Wind + Storage + Backstop) | ~90-98% | 100% | Extreme multi-day generation droughts | $0.08-$0.12/kWh (blended firm) |
The 2024 Massachusetts Climate Act extended and tightened the state's large-load reporting and environmental-justice framework. For data centers — which almost always exceed the 1 MW large-load threshold — this creates new compliance overhead but also creates leverage points where on-site solar, BESS, and VPPA procurement directly reduce risk and siting friction. Operators that proactively integrate solar and storage into their MA Climate Act filings consistently achieve faster siting approvals, particularly in Designated Geographic Areas where cumulative-impact scrutiny is highest.
Facilities drawing more than 1 MW must file annual energy use and emissions reporting with MA DOER. For data centers this is a routine compliance step; the form also captures REC retirement claims and counts against MA statewide 2050 net-zero accounting.
Operator takeaway: Align VPPA REC retirement and SMART 3.0 on-site production data before the annual filing window to avoid double-counting disputes.
New or expanding large-load facilities within Designated Geographic Areas (including parts of Worcester, Springfield, and Boston) must complete an EJ impact assessment addressing cumulative air, noise, and traffic burdens. Diesel generator fleets often trigger the most scrutiny.
Operator takeaway: On-site solar + BESS reduces generator runtime hours in testing and event scenarios, which directly improves EJ impact scoring and can unblock siting in EJ communities.
Commercial buildings over 20,000 sq ft (BERDO in Boston, statewide BPS in development) face emissions intensity limits. Data center cooling and admin load falls under these standards even if IT load is exempt in some frameworks.
Operator takeaway: Pair on-site solar with heat-recovery from cooling systems and behind-the-meter BESS to stay under emissions-intensity caps without expensive carbon offsets.
Retail suppliers must procure a growing share of energy delivered during seasonal peak hours from clean resources. BESS discharge during Clean Peak windows earns Clean Peak Energy Certificates (CPECs) valued at roughly $25-$45/MWh.
Operator takeaway: Behind-the-meter BESS at data center sites can monetize Clean Peak dispatch alongside ConnectedSolutions, stacking two revenue streams against a single battery asset.
Most hyperscalers use out-of-region VPPAs for the bulk of voluntary Scope 2 claims and hold smaller Class I positions for in-region signaling and tenant-facing marketing.
The reason on-site and in-region physical solar stays a supporting act in Massachusetts is not only rooftop math — it is the interconnection queue. Any behind-the-meter array or battery a data center adds still has to interconnect with Eversource, National Grid, or Unitil, and once a project or the aggregate queue on a feeder trips a thermal or voltage limit it lands in a Group (cluster) Study, where the utility evaluates the cohort together and allocates transformer, feeder, and substation upgrade costs pro-rata by nameplate. Substation-scale upgrades in particular are almost never caused by one project alone, and they can dominate the economics of an in-region build.
Massachusetts is actively reworking this process under DPU Docket 25-48, which targets unpredictable review timelines, “queue-squatting” from speculative applications, and hosting-capacity maps that today do not show pending queue positions. Until those reforms fully land, an operator sizing a behind-the-meter battery for ConnectedSolutions and Clean Peak should pull a Pre-Application Report early and read the circuit's real available capacity net of the queue — and it is exactly this friction that pushes the bulk-Scope-2 job onto an out-of-region VPPA, which never touches an ISO-NE interconnection study at all.
Data center UPS architecture already assumes N+1 or 2N redundant battery support for short-duration ride-through. Extending that architecture with a grid-tied behind-the-meter battery (5-20 MW / 4-hour) turns a resilience asset into a three-revenue-stream asset: (1) peak shaving against the ISO-NE ICAP tag and transmission peak hour, (2) ConnectedSolutions summer dispatch payments from Eversource and National Grid, and (3) Clean Peak Energy Certificates for discharges within designated seasonal peak windows. A well-designed battery captures all three without compromising IT resilience.
Discharging during the ISO-NE coincident peak hour reduces the facility's capacity-market tag, cutting Forward Capacity Market charges by roughly $15-30 per kW-year of reduction.
Summer dispatch program paying roughly $200-$300 per kW of committed capacity for 30-60 events annually. A 5 MW pledge earns $1.0-1.5 million per year.
Battery discharges inside designated Clean Peak windows earn Clean Peak Energy Certificates at roughly $25-$45 per MWh — a third revenue stream on the same asset.
Direct Revenue
Avoided Cost
Combined: $3.0-5.2M per year before §48E credit monetization. Stacks on top of a VPPA for Scope 2 without conflict — the VPPA delivers the RECs, the battery delivers the peak economics.
Complete commercial solar guide: §48E ITC stacking, SMART 3.0, utility rates, pricing, and ROI for Massachusetts businesses.
Eversource and National Grid commercial battery demand-response program mechanics, payment structure, and dispatch obligations.
ICAP tag shaving, transmission peak avoidance, and Clean Peak Energy Certificates for large MA commercial loads.
How the §48E Clean Electricity ITC works for commercial solar leases and PPAs, including the dual timing pathway around July 4, 2026.
Selling federal solar tax credits for cash: mechanics, pricing, buyer universe, and due-diligence steps for MA operators.
Playbook for large MA commercial operators pursuing 100% renewable commitments: on-site, off-site, VPPA, and Class I RECs.
The 2024 Climate Act 5 GW storage target: what it means for commercial operators, pricing implications, and procurement options.
RFP templates, evaluation criteria, and procurement best practices for large MA commercial solar and PPA contracts.
Put a rooftop array on a Massachusetts hall and you get 0.5-2 MW against a building that pulls 10-50 MW nonstop — even a maxed-out roof lands at 2-5% of the year's consumption. A virtual PPA sidesteps that ceiling entirely. The operator signs with a utility-scale solar farm in a sunnier, higher-capacity-factor grid like ERCOT or PJM; that farm sells its generation into its own wholesale market, the data center settles the gap against a fixed strike price, and the renewable energy certificates transfer north for Scope 2 reporting. Not one electron crosses a state line — it is a financial swap bundled with a REC transfer. Crucially for Massachusetts, the structure scales from 10 MW to 500+ MW without waiting on scarce local roof area or the multi-year ISO-NE interconnection queue that a physical in-region project would have to clear.
NuWatt helps MA data center operators design layered portfolios — on-site solar for admin and signaling, behind-the-meter BESS for ConnectedSolutions and Clean Peak revenue, and off-site VPPAs for Scope 2 RECs. ISO-NE market expertise, MA Climate Act compliance support, and full procurement diligence.